Top 3 Price Prediction Bitcoin, Ethereum, Ripple: Beware of groupthink as crypto bellwethers test support
- Bitcoin price accelerating to the downside as the May 19 low moves into the crosshairs.
- Ethereum price triggers bear pennant pattern, driving ETH to $2,300.
- XRP price releases from bear flag pattern, testing the critical support at $0.780.

Bitcoin price on pace for the third consecutive down month, equalling the July 2019-September 2019 period. Ethereum price revealed a long-legged doji on the monthly chart, warning of indecision and distribution in May, despite the stellar performance to begin May. XRP price testing critical support for the second time since the end of May.
Bitcoin price narrative facing new test as doubters multiply
Bitcoin price had been defining a bearish pennant pattern on the daily chart since May 19, before executing a breakout to the upside on June 3. On June 4, the breakout quickly reversed, creating a bull trap for investors that was soon confirmed with a decline below the pennant’s lower trend line on June 7 with a bearish engulfing day on the bar charts.
The measured move target for the bear pennant pattern is $18,630, representing just over a 47% decline from yesterday’s breakdown. The target is based on the length of the flagpole preceding the pennant. The target coincides very closely with the 2017 high at $19,891.
Currently, Bitcoin price has undercut the May 23 low at $31,111 but refrained from testing the May 19 low at $30,000. It is a price range that could catch bears off guard by generating a BTC rebound. Only a daily close below $30,000 would solidify the projection of a test of the 61.8% Fibonacci retracement of the 2020-2021 advance at $27,175.
A daily close below the 61.8% retracement exposes Bitcoin price to a decline to the 2017 high at $19,891 and potentially the measured move target of $18,630.
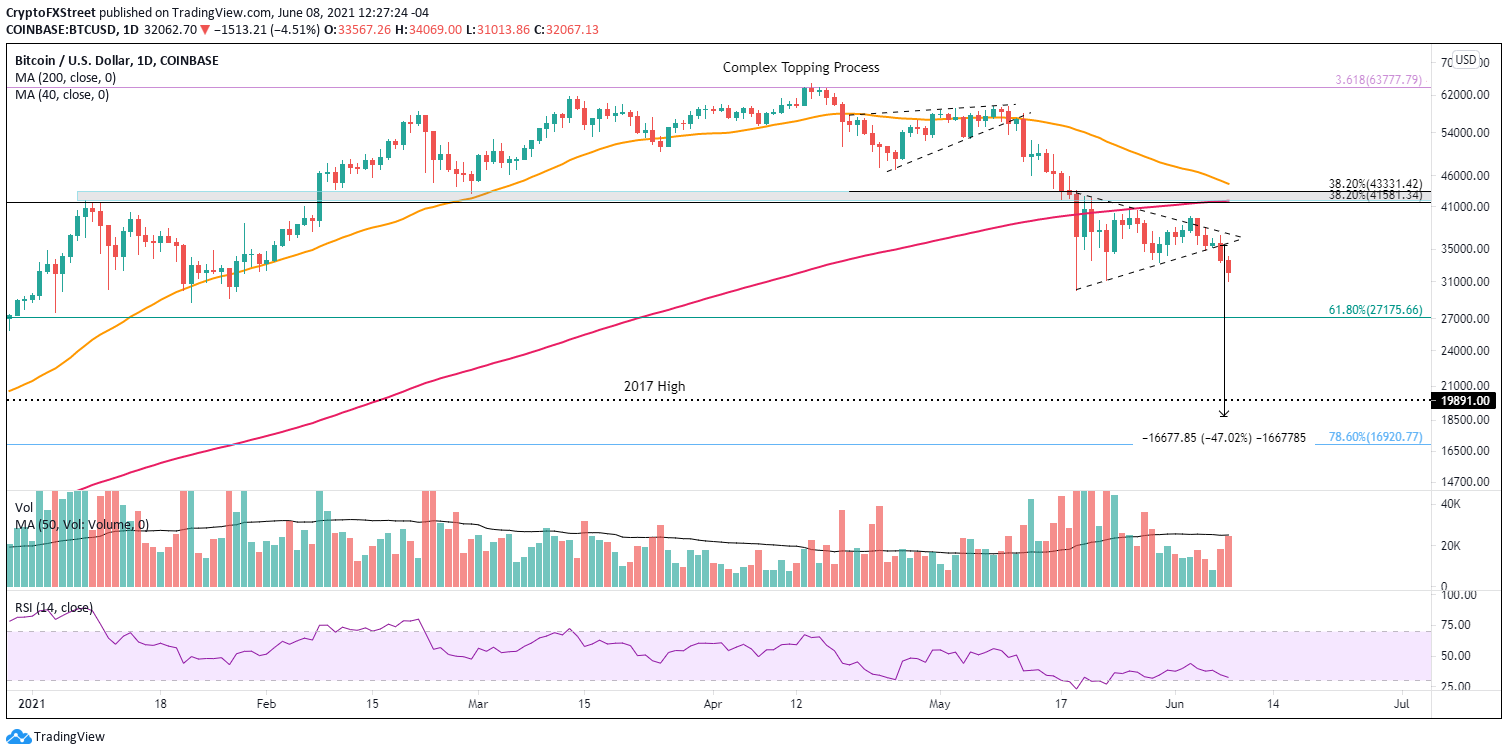
BTC/USD daily chart
To banish the noted bearish outlook, Bitcoin price needs a daily close above $36,812.
It is essential to acknowledge the overwhelming bearishness among financial market commentators, with targets reaching the 200-week simple moving average at $13,055. When there is a noteworthy tilt in sentiment, it often fails to come to reality, and investors need to keep that present as the May lows are now in play.
Ethereum price leadership dissolves as a spooked market turns south
Similar to Bitcoin price, Ethereum price defined a bearish pennant pattern that initially released to the upside on June 3. Still, it was quickly met with notable resistance at the 50-day SMA at $2,895. On June 4, ETH reversed the breakout and by June 5 was below the pennant’s lower trend line on a closing basis.
Yesterday’s bearish engulfing day on the bar charts was a tell that Ethereum price was on the verge of a decline. The measured move target is $1,257, yielding a 51% decline from the position of the lower trend line today.
To achieve the tremendous ETH decline, Ethereum price needs to overcome support at the May 30 low at $2,647, the May 23 low at $1,728, the 200-day SMA at $1,616 and eventually the 2018 high at $1,419.

ETH/USD daily chart
If Ethereum price can register a daily close above $2,785, the outlook snaps to neutral for ETH investors and places the smart contracts token on the path to stabilization.
The last two days have proven that the environment for the cryptocurrency complex is highly fluid and vulnerable to wide price swings. The bearish tilt in the Ethereum price could flip very quickly, so investors need to be agile and disciplined in their entries and position sizing.
XRP price revisits key level in search of support
To review, XRP price illustrated a cup-with-high-handle base on the four-hour chart from May 26 until June 3, with a measured move target of $1.539, delivering a 40% return from the handle high at $1.100. The development of the pattern had been consistent with successful historical precedents, defined by increasing volume on the right side of the cup and then progressively lower volume through the handle construction.
The optimistic outlook featured by the cup-with-high-handle based failed to materialize as XRP price proceeded to fall below the larger bear flag trend line on June 5 and then closed with a bearish engulfing day yesterday on the bar charts.
The measured move target of the Ripple bear flag pattern is $0.432, offering stubborn investors a 53% loss from the June 5 breakdown. It is calculated using the length of the flagpole preceding the flag. A drop of that magnitude leaves XRP price rooted in the legal uncertainty price range that followed the November 2020 high into the December 2020 low.
Today, XRP price is now holding the critical support at $0.780 after breaching the May 29 and May 30 lows at $0.793 and $0.796, respectively. A daily close below $0.780 may usher in a decline to the 200-day SMA at $0.712 or even the May 23 low at $0.652.
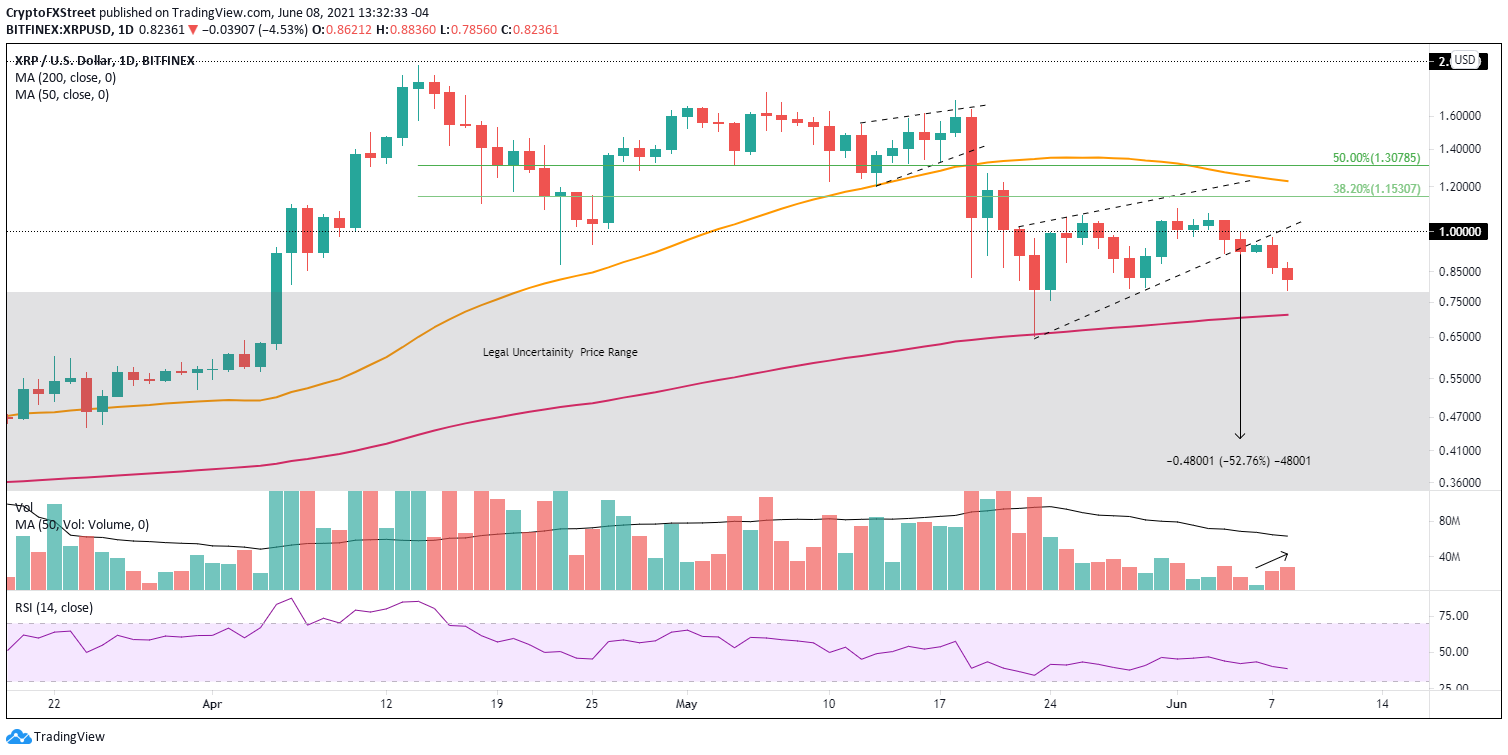
XRP/USD daily chart
If XRP price closes above the psychologically important $1.00 on a daily basis, it will be a reversal of fortune for Ripple investors.
XRP price has failed to achieve any notable trading outcomes, excluding the bounce from the May 23 low. Ripple is wrestling with the overhang of the broader crypto market while trying to piece together the interesting fundamental story into a compelling narrative for investors.
Concluding thought
Outside some of the large institutional investors and well-known individual investors, the general group narrative for the cryptocurrency market is decidedly bearish with varying price targets. Many of the commentators are employing similar technical analysis frameworks and on-chain metrics to justify their bearish projections. Nevertheless, individual investors need to refrain from buying into the pervasive groupthink and seek confidence from a disciplined investment program.
Experience suggests that when there is a widely agreed upon outlook, the markets reverse course because it has become too obvious. The cryptocurrency market could be at one of those reversal moments as bellwether cryptocurrencies are near or at pivotal support levels.
Author

Sheldon McIntyre, CMT
Independent Analyst
Sheldon has 24 years of investment experience holding various positions in companies based in the United States and Chile. His core competencies include BRIC and G-10 equity markets, swing and position trading and technical analysis.


