Top 3 Price Prediction Bitcoin, Ethereum, Ripple: Bears get ahead but are not leading
- Sellers show more strength than buyers but with no advantage in controlling the market.
- Market sentiment remains upbeat and diverges from the technical structure.
- Ripple quickens the consolidation process and shows the way ahead.

The week is coming to an end, and on Friday, we are seeing some modest rises by the primary crypto board protectors.
Ethereum is the best Top 3 member at this time and recovers some of the ground lost to Bitcoin in recent weeks. The current climb does not seem to be able to finish the consolidation movement, and we should still wait a couple of weeks to see new developments.
The market forces are facing each other, but neither side opens fire in the technical confrontation that – according to all indications – should take place soon.
The downward movement is in full swing, and the bulls are less and less likely to turn the downward trend around.

Source: alternative.me
The market sentiment is now at level 74 and shows a very high level of confidence in which the uptrend will continue without pause. The long term graph of the sentiment level shows a zone of congestion that typically leads to a sharp drop in the confidence level.
ETH/BTC Daily Chart
ETH/BTC is currently trading at 0.03411, showing strength and interest to stay above the support level of 0.0333. The 50-day exponential moving average is a significant attractor and is most likely a target for the lows. This moving average today is hovering around 0.032.
Above the current price, the first resistance level is at 0.035, then the second at 0.03675 and the third one at 0.0372.
Below the current price, the first support level is at 0.0332, then the second at 0.0317 and the third one at 0.030.
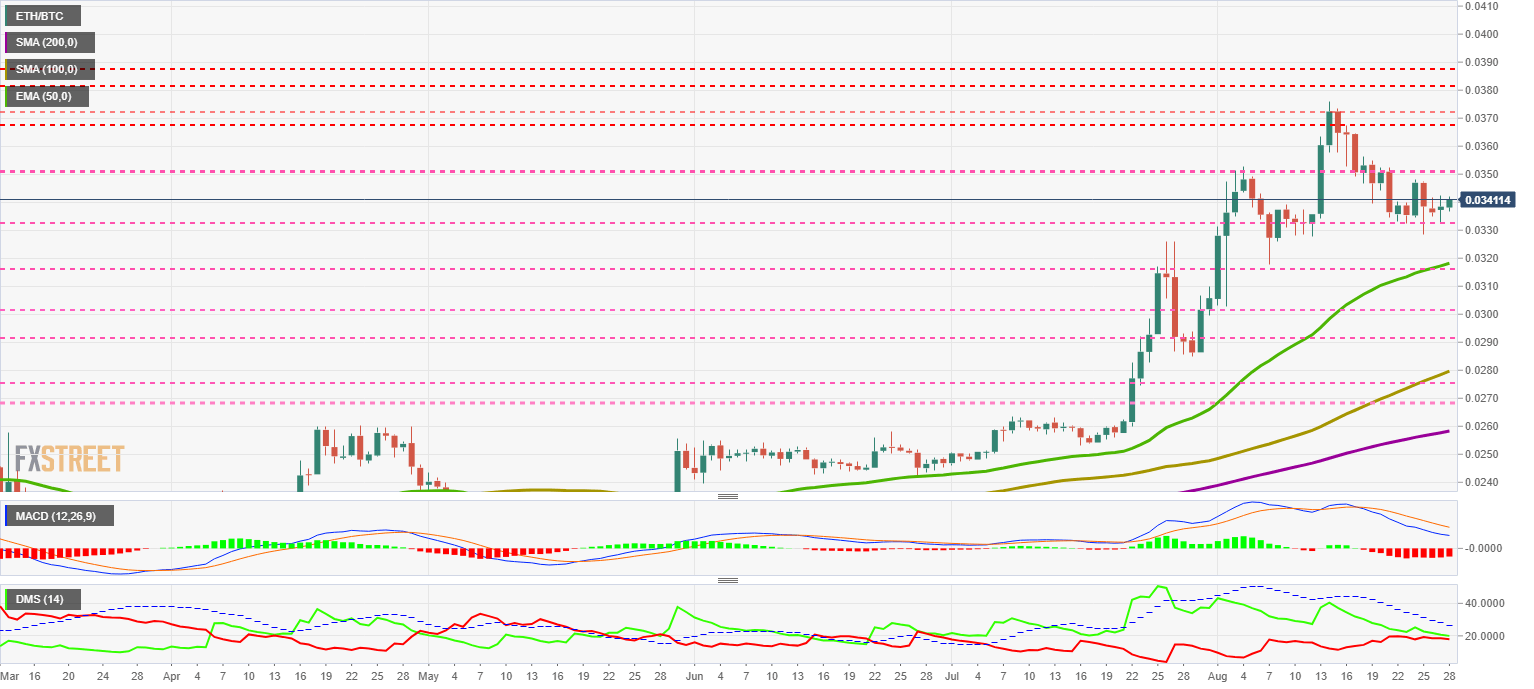
The MACD on the daily chart follows the typical downward trend. The current position – in a zone between the high and the neutral level of the indicator – usually causes small upward corrections.
The DMI on the daily chart shows bears and bulls sharing a level but never touching. The market will remain relatively calm until the two sides come into contact – which will add volatility to the price.
BTC/USD Daily Chart
BTC/USD is currently trading at $11,394, similar to Thursday’s level, just above the price congestion support level of $11,300. The 50-day exponential moving average is at the $11,000 price level.
Above the current price, the first resistance level is at $12,300, then the second at $14,000 and the third one at $17,200.
Below the current price, the first support level is at $11,300, then the second at $11,000 and the third one at $10,650.
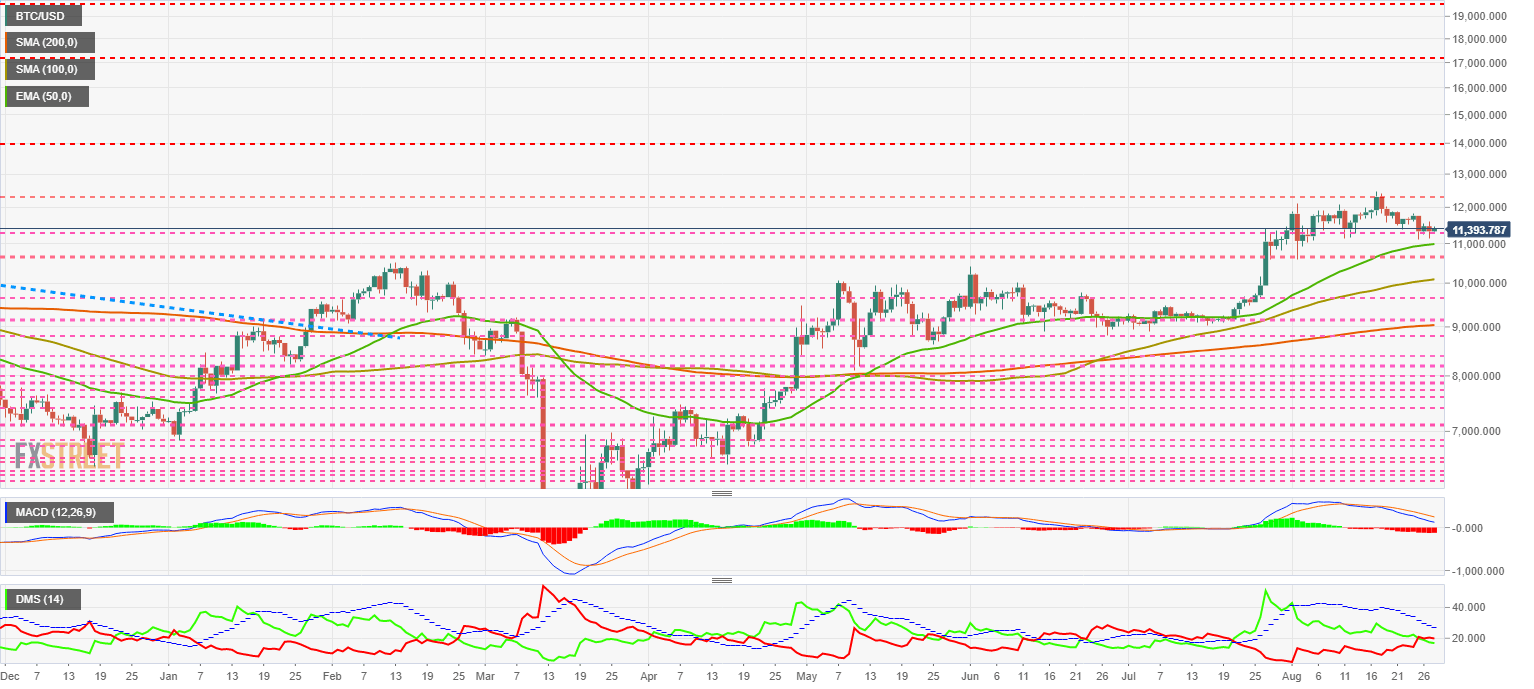
The MACD on the daily chart continues to move down naturally, maintaining the profile both in slope and in separation between the moving averages.
The DMI on the daily chart shows bears outperforming bulls and attempting to move away from them to take control of the pair.
ETH/USD Daily Chart
ETH/USD is currently trading at $388.12 and is following Bitcoin’s lead by staying above the critical support level of $385.
Above the current price, the first resistance level is at $440, then the second at $460 and the third one at $485.
Below the current price, the first support level is at $385, then the second at $360 and the third one at $315.
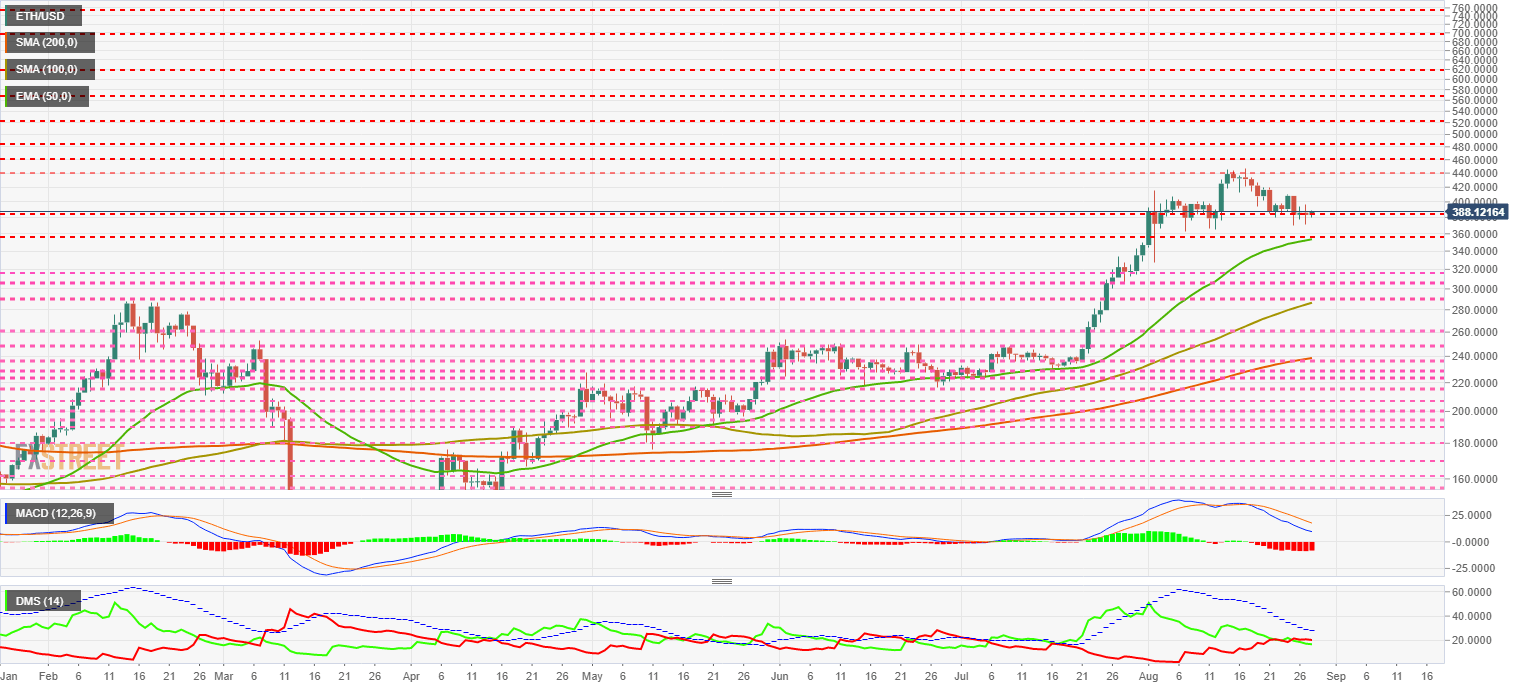
The MACD on the daily chart shows no change in the bearish profile and suggests that the bearish trend is continuing normally.
The DMI on the daily chart shows the bears overtaking the bulls but not gaining much advantage at the moment.
XRP/USD Daily Chart
XRP/USD is currently trading at $0.26666 and, holding above the 50-day exponential moving average. If Ripple loses support in this zone, a scenario of $0.22 would be highly likely.
Above the current price, the first resistance level is at $0.271, then the second at $0.282 and the third one at $0.289.
Below the current price, the first support level is at $0.26, then the second at $0.253 and the third one at $0.235.
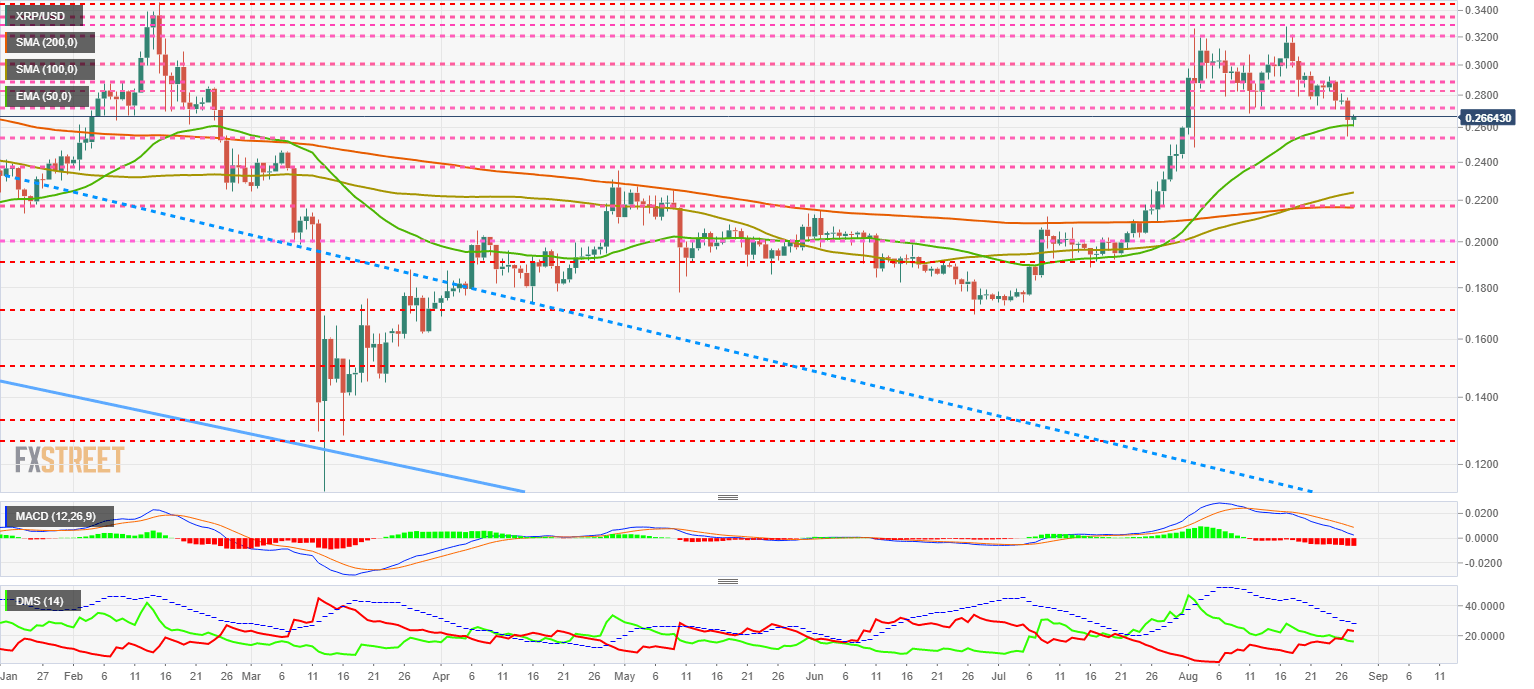
The MACD on the daily chart is approaching the neutral level of the indicator, and it will be interesting to see how XRP/USD performs as an advance on the rest of the market.
The DMI on the daily chart shows the bears taking advantage of the bulls and very close to reaching the ADX line – the real acid test for absolute control of the pair.
Author

Tomas Salles
FXStreet
Tomàs Sallés was born in Barcelona in 1972, he is a certified technical analyst after having completing specialized courses in Spain and Switzerland.


