Top 3 Price Prediction Bitcoin, Ethereum and XRP: Rejection opens the Pandora box
- Bitcoin suffers rejection at $11,000 as retreat begins, support is expected above $10,500.
- Ethereum hits a wall at $360 again, giving way for consolidation above crucial support at $345.
- XRP is likely to resume the uptrend to $0.28, especially if the bull flag breakout materializes.

The cryptocurrency market lost steam over the weekend, somehow giving way for bears to regain control. For instance, the largest cryptoasset Bitcoin closed in on $11,000 after overcoming the resistance explored on Friday at $10,800. However, the king of digital assets failed to break the resistance at $11,000.
The slow traction witnessed across the board apart from some selected cryptocurrencies such as Cardano (ADA), spiked above $0.10 as predicted. Other digital assets performing relatively well include Cosmos (ATOM), up 7.48% in the last 24 hours and THETA, up 7.95% in the same period.
Bitcoin stalls under $11,000
As mentioned, Bitcoin rolled towards $11,000 but hit a wall at $10,986. The rejection from this level has seen bulls rush to defend the support at $10,800. The Relative Strength Index (RSI) recovered above the midline, hence the gains that almost hit $11,000. However, the indicator, which measures the strength of a trend has slowed down the uptrend and seems to favor a sideways movement at 65. If the RSI is to hold onto the horizontal direction, consolidation will take over in remaining sessions on Monday.
The formation of a rising wedge in the same 4-hour foresees resistance heading towards $11,000 and $11,200 levels, respectively. A rising wedge pattern occurs in instances where an asset’s price has been rising over a period. Trendlines are drawn above and under the price on the chart, and they tend to converge. A rising wedge pattern signals a potential reversal in the price following a breakout from the lower trendline.
BTC/USD 4-hour chart
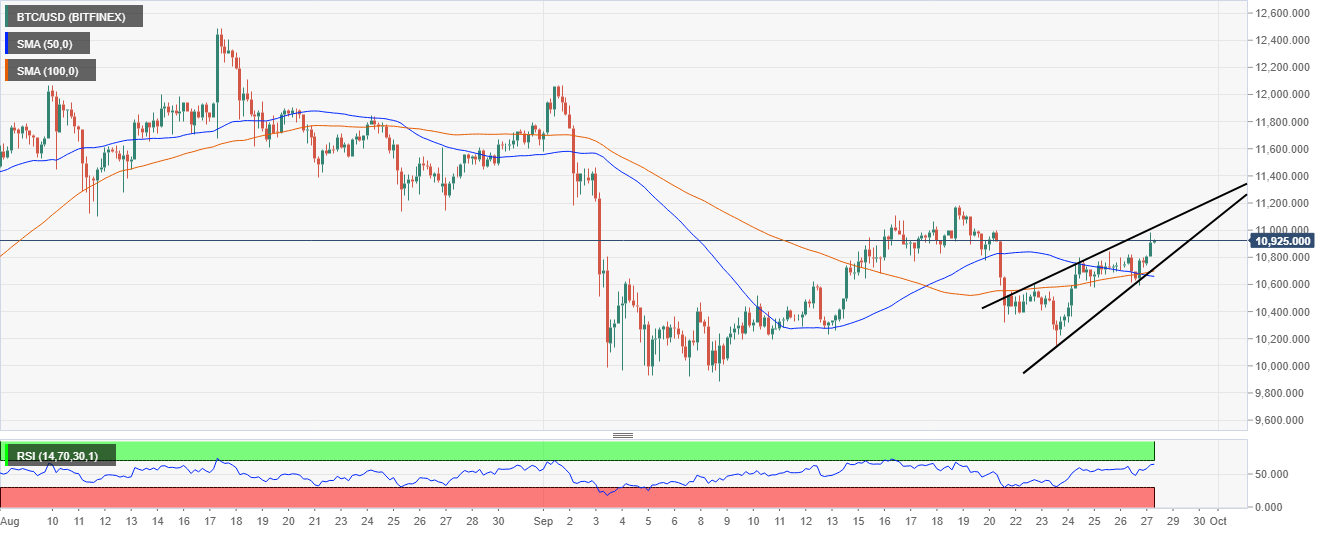
In this case, if Bitcoin fails to rise above $11,000 and is rejected again, a break below the lower trendline would signal losses towards $10,500. Note that Bitcoin will try to seek support at the 100 Simple Moving Average (SMA) and the 50 SMA in a bid to absorb the selling pressure and invalidate the downtrend.
IntoTheBlock’s IOMAP model suggests growing supply barriers running up to $12,000. However, the most robust resistance lies in the range, $11,567 - $11,895. The zone is highly congested with investors who had previously purchased BTC around that price. Here, 1.04 million addresses are holding nearly 727,000 BTC. The range might absorb some of the buying pressure, especially if Bitcoin bulls push the price above $11,000. However, if Bitcoin slices through this area, it would likely spike to $12,500.
Bitcoin IOMAP chart
-637368731327733294.png)
On the flip side, the largest cryptocurrency is sitting on areas with immense support due to the investors who previously bought BTC in the range, $10,582 - $10,910. Here, 1.55 million addresses are holding 1.08 million BTC. If Bitcoin falls from the prevailing price level, this zone would have the potential to absorb most of the selling pressure. For now, consolidation is the most probable price action for BTC.
Ethereum bulls focus on breaking $360 resistance
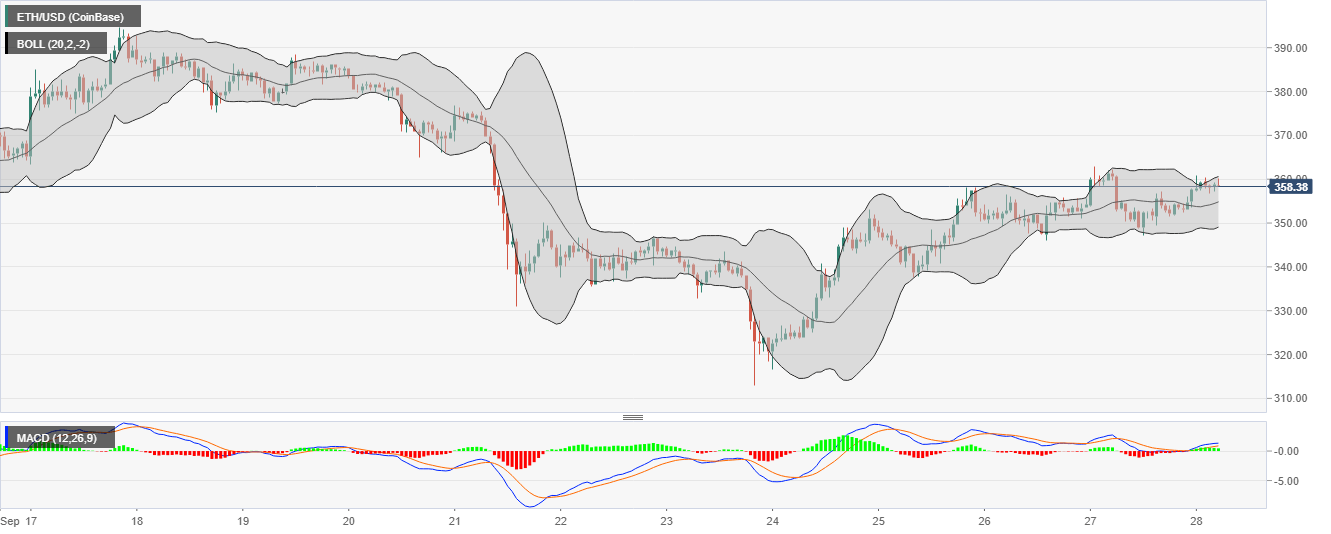
Ethereum stalled at $360 over the weekend, as reported earlier. However, buyers are not letting go of the fight to push Ether above this hurdle and relaunch the journey to $400. At the moment, ETH is trading at $358. The Bollinger Bands in the hourly range highlight the possibility of volatility rising in the coming sessions.
A break above $360 is bound to encourage more buyers to join the market, creating the volume for more upward action. The Moving Average Convergence Divergence (MACD) shines a light on the bullish narrative by holding in the positive region. A bullish divergence above the MACD suggests that buying pressure is rising, but gradually.
ETH/USD hourly chart
IntoTheBlock’s IOMAP metric shows that the path to $400 is laced with substantial hurdles beginning at $358 - $369. Nearly 515,000 addresses previously bought 2.88 million ETH in this range. If Ethereum hits highs above $360, it may not spike to $400 quickly because investors in this area will try to break even on their positions hence slowing down the uptrend.
On the downside, immense support is highlighted between $346 and $357. Around 603,000 addresses had bought 10.56 million Ethereum in the zone. Bears will try to pull Ether below this area, but odds are still bulls' favor, at least for now.
Ethereum IOMAP chart
-637368732357442958.png)
XRP poised for a spike to $0.28
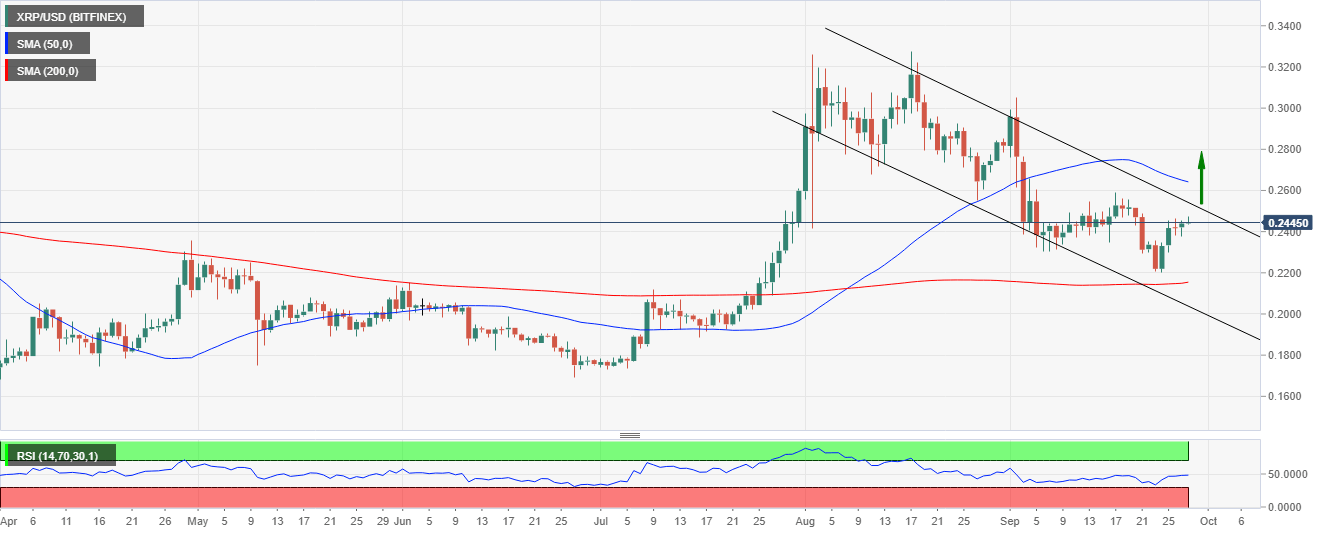
XRP bounced off last week’s support at $0.22 and extended the action above several vital levels, including $0.23 and $0.24. At the time of writing, XRP is trading at $0.2443 amid a sideways trend, as highlighted by the RSI. The indicator measures the extent of price changes in the recent past to gauge overbought and oversold conditions. For now, XRP has room for growth, but the spike to $0.28 will depend on the breakout from the bull flag. A close beyond the 50-day SMA would cement the bulls’ position in the market, thereby allowing bulls to keep their focus on $0.28.
XRP/USD daily chart
As XRP awaits the breakout, investors are busy accumulating the tokens, perhaps capitalizing on the anticipated rally to $0.28 and $0.30. Santiment, a popular on-chain data analytics platform, shows that addresses holding between 10,000 and 100,000 XRP have increased in the last one month from 97,484 to 100,680. Similarly, addresses containing between 100,000 and 1,000,000 XRP increased from 16,169 to 16,804 in the same period. If this buying pressure continues, XRP is likely to continue with the uptrend, supported by volume inflow.
XRP holder distribution chart
 [10.01.56, 28 Sep, 2020]-637368733248471965.png)
All the top three cryptocurrencies rallied from their support levels last week, but critical resistance hurdles are still in place. Bitcoin is yet to break above $11,000. Rejection from the current price level is likely to find support above $10,500. Ethereum has not overcome the hurdle at $360 and gains to $400 will not come easy. Support between $346 and $357 is strong enough to absorb the selling pressure in case of a breakdown. As observed, XRP is looking towards a bull flag breakout, targeting $0.28.
Author

John Isige
FXStreet
John Isige is a seasoned cryptocurrency journalist and markets analyst committed to delivering high-quality, actionable insights tailored to traders, investors, and crypto enthusiasts. He enjoys deep dives into emerging Web3 tren


