![]() Rajarshi Mitra
Rajarshi Mitra
Independent Analyst
- RSI indicator in the BTC/USD daily chart is trending within the overbought zone.
- The Fear and Greed Index has held steady at around 40 in the "Fear" zone.
Bitcoin, Ethereum, and Ripple bears took control this Thursday to correct this Wednesday’s bullish action. The price action of the coins look like this:
- BTC/USD has gone up from $8,828.49 to $8,829.
- ETH/USD has gone up from $212 to $212.40
- XRP/USD has gone down from $0.2178 to $0.217.
Fear and Greed Index
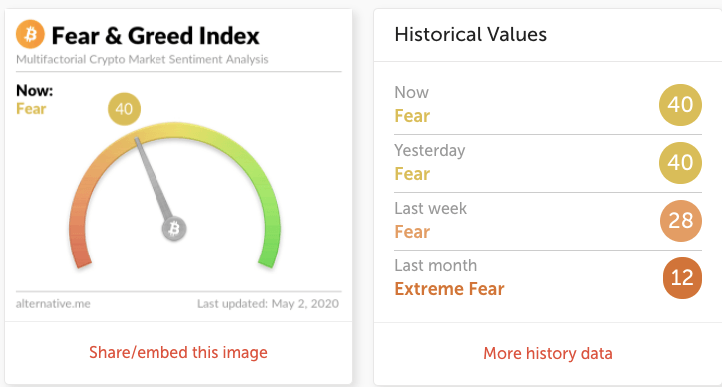
Alternative.me’s fear and greed index has kept steady around 40, and the current market sentiment is still in the “fear” region. This indicates that there is still some upside potential for Bitcoin.
ETH/BTC daily chart
-637239891002883654.png)
ETH/BTC has gone up from 0.0239 to 0.0241 but has failed to keep pace with the green Ichimoku cloud. Bulls must gather enough momentum to break past the 0.0243, the SMA 50 and 0.0248. On the downside, there are healthy support levels at 0.0239 and 0.0235. The MACD shows increasing bearish momentum, while the Elliott Oscillator has had six straight red sessions.
BTC/USD daily chart
-637239894775255845.png)
BTC/USD is currently consolidating in a flag formation below the $9,000 level. The price is sitting just below the upper curve of the 20-day Bollinger Band. On the upside, the price faces strong resistance levels at $9,161.75 and $9444.58. This means that the price can go up to the $9,000-level before encountering resistance. On the downside, there are two healthy support levels at $8,616.20 and $8,191.90. The RSI indicator is hovering at the edge of the overbought zone, showing that the asset is a bit overpriced and may face short-term bearish correction.
ETH/USD daily chart
-637239895351157962.png)
The daily ETH/USD chart is consolidating below the $215-level within the triangle formation. The price faces three strong resistance levels at the upward trending line, $224,78 and $232. On the downside, healthy support levels lie at $206.50 and $198. The RSI is hovering right next to the overbought zone, while the Elliott Oscillator has had eight straight green levels.
XRP/USD daily chart
-637239895943870617.png)
XRP/USD fell from $0.2178 to $0.217 in the early hours of Saturday. This Friday, the price encountered resistance at the 20-day Bollinger Band upper curve and fell down. The widening of the jaw shows increasing price volatility. If the bulls gain back momentum, they’ll need to overcome resistance at the $0.225 line and the SMA 200. Following that, the next resistance level of note lies at $0.2377. On the downside, there are two healthy supports at $0.2125 and $0.203. The Elliott Oscillator has had eight straight green sessions, while the MACD shows increasing bullish momentum.
Note: All information on this page is subject to change. The use of this website constitutes acceptance of our user agreement. Please read our privacy policy and legal disclaimer. Opinions expressed at FXstreet.com are those of the individual authors and do not necessarily represent the opinion of FXstreet.com or its management. Risk Disclosure: Trading foreign exchange on margin carries a high level of risk, and may not be suitable for all investors. The high degree of leverage can work against you as well as for you. Before deciding to invest in foreign exchange you should carefully consider your investment objectives, level of experience, and risk appetite. The possibility exists that you could sustain a loss of some or all of your initial investment and therefore you should not invest money that you cannot afford to lose. You should be aware of all the risks associated with foreign exchange trading, and seek advice from an independent financial advisor if you have any doubts.
Recommended Content
Editors’ Picks

Axiom’s volume surpasses $100M as meme trading platform war escalates on Solana
Axiom meme coin trading volume hit $101 million for the first time, surpassing other platforms on Solana. Axiom accounts for 30% of the ecosystem’s trading users, followed by Photon and Bullx at 24% each.

Bitcoin aiming for $95,000 as Global M2 money supply surges
Bitcoin (BTC) price edges higher and trades slightly above $85,500 at the time of writing on Tuesday after recovering nearly 7% the previous week. The rising Global M2 money supply could be a favorable signal for both Gold and Bitcoin.

Top 3 gainers Brett, Story and Virtuals Protocol sparkle as Bitcoin eyes $90,000
Cryptocurrencies have sustained a buoyant outlook since last week as US President Donald Trump’s tariff war was paused for 90 days, except for China, propping global markets for lifeline relief rallies.

Three altcoins to watch this week: ALGO, MANA and JASMY show bullish signs
Algorand, Decentraland and JasmyCoin hovers around $0.19, $0.27, and $0.015 on Tuesday after a double-digit recovery last week. ALGO, MANA and JASMY approach their key resistance levels; breakout suggests a rally ahead.

Bitcoin Weekly Forecast: Market uncertainty lingers, Trump’s 90-day tariff pause sparks modest recovery
Bitcoin (BTC) price extends recovery to around $82,500 on Friday after dumping to a new year-to-date low of $74,508 to start the week. Market uncertainty remains high, leading to a massive shakeout, with total liquidations hitting $2.18 billion across crypto markets.

The Best brokers to trade EUR/USD
SPONSORED Discover the top brokers for trading EUR/USD in 2025. Our list features brokers with competitive spreads, fast execution, and powerful platforms. Whether you're a beginner or an expert, find the right partner to navigate the dynamic Forex market.