Top 3 Price Prediction Bitcoin, Ether, Ripple: Ether plays its cards to gain dominance
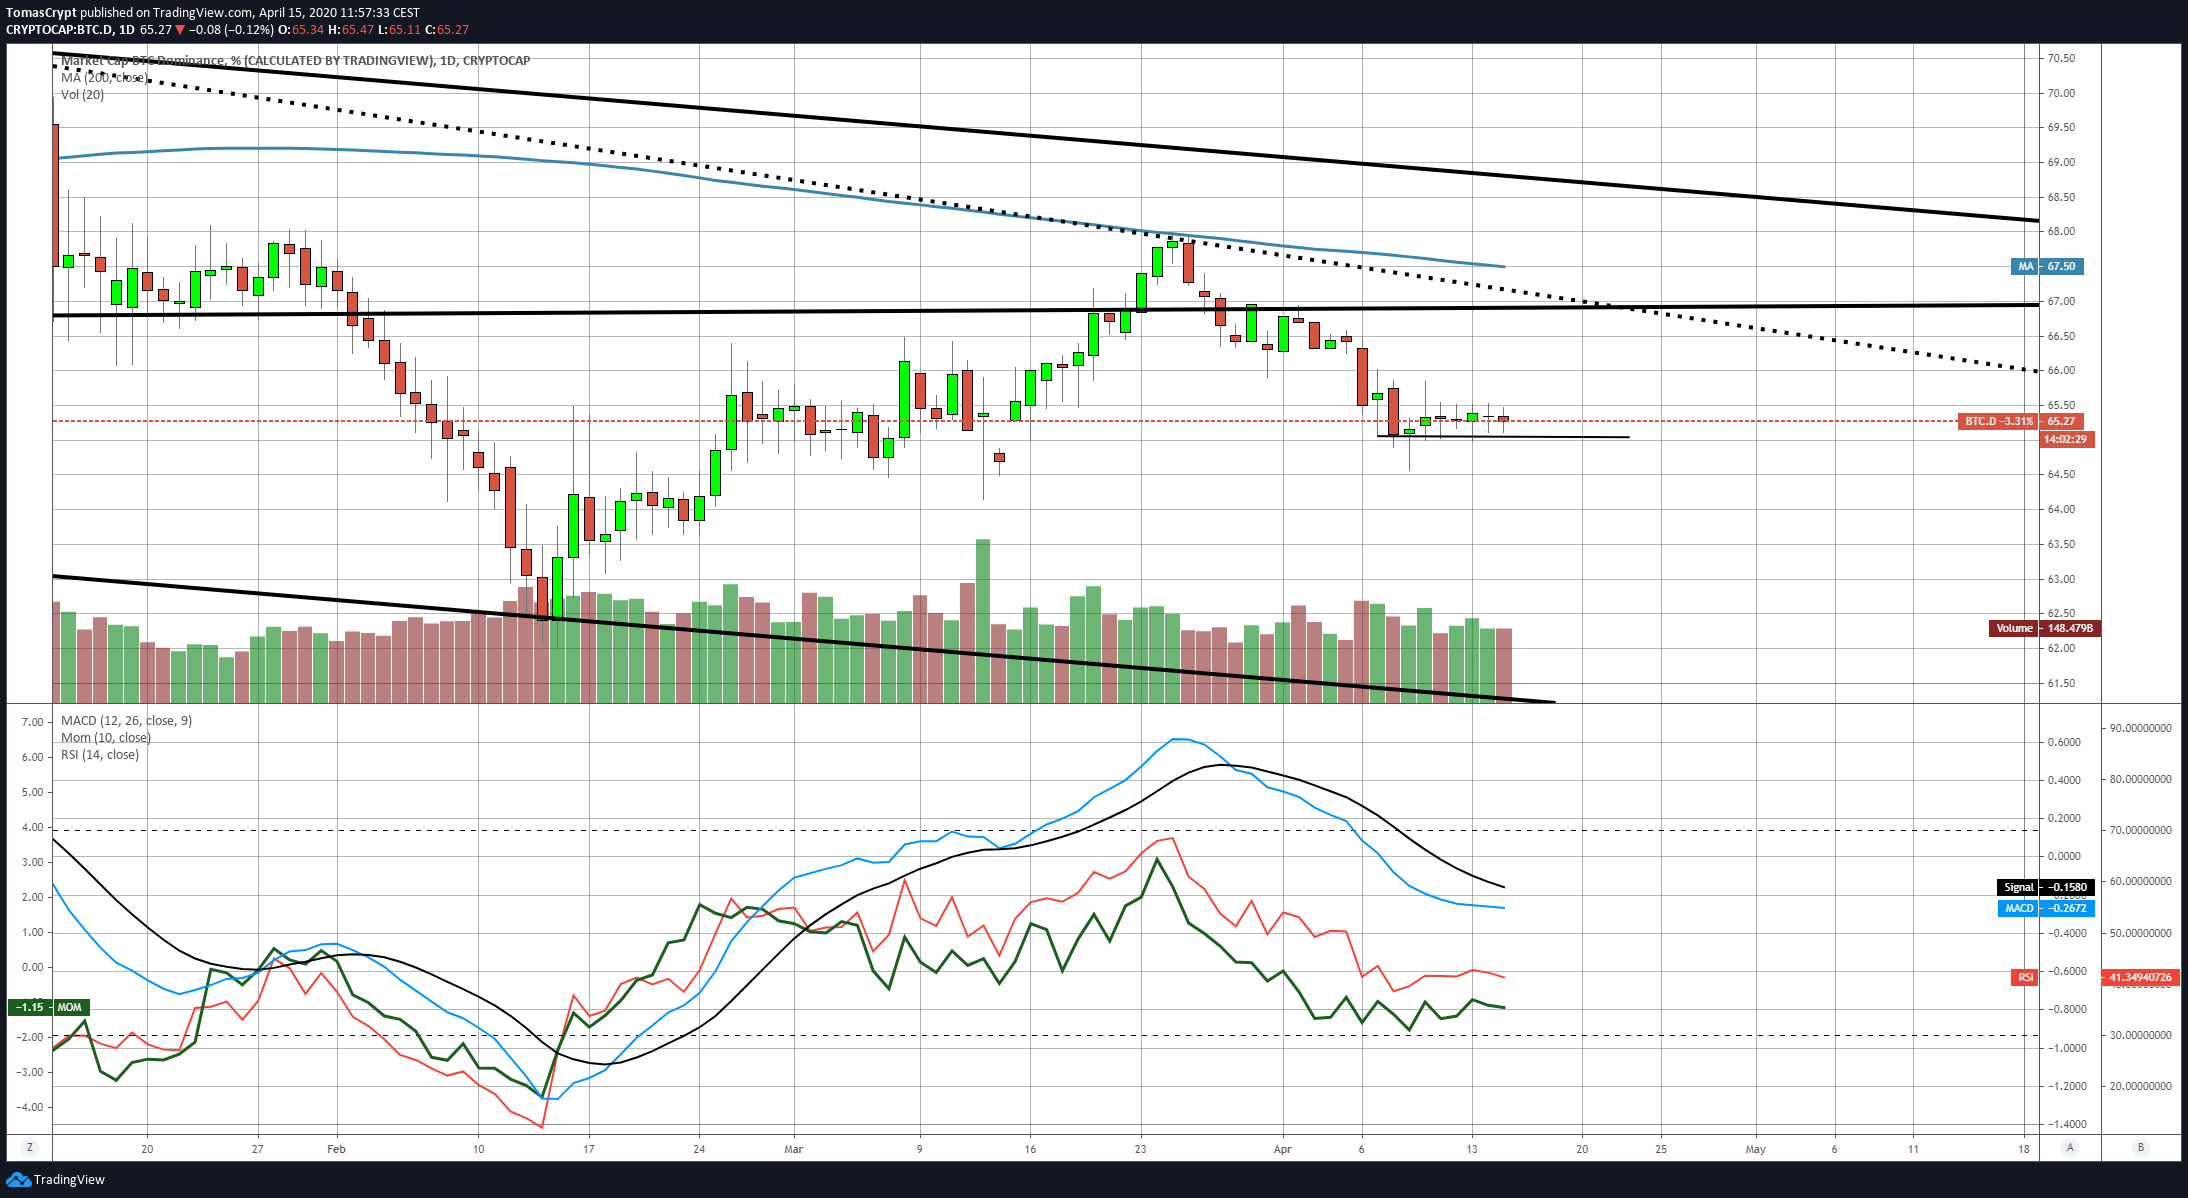
- The dominance charts show a game on the edge to increase the market share between Bitcoin and Ether.
- The Top 3 replicate ambiguous technical structures and open the door to unexpected movements in any direction.
- Market sentiment is improving but still far from where the spot price is.

The crypto market is showing signs of a rapid and unexpected turn of events this morning.
When everything announced a lateral move in the short term, the market dominance indicators are announcing something different.
The Ether's dominance chart is improving significantly and, in the absence of confirmation in the next 24-36 hours, could give the signal for an upward move.
The resistance level to beat (A) is 9.13 of dominance for the Ether, then the next at 9.75 and the third one at 10.40
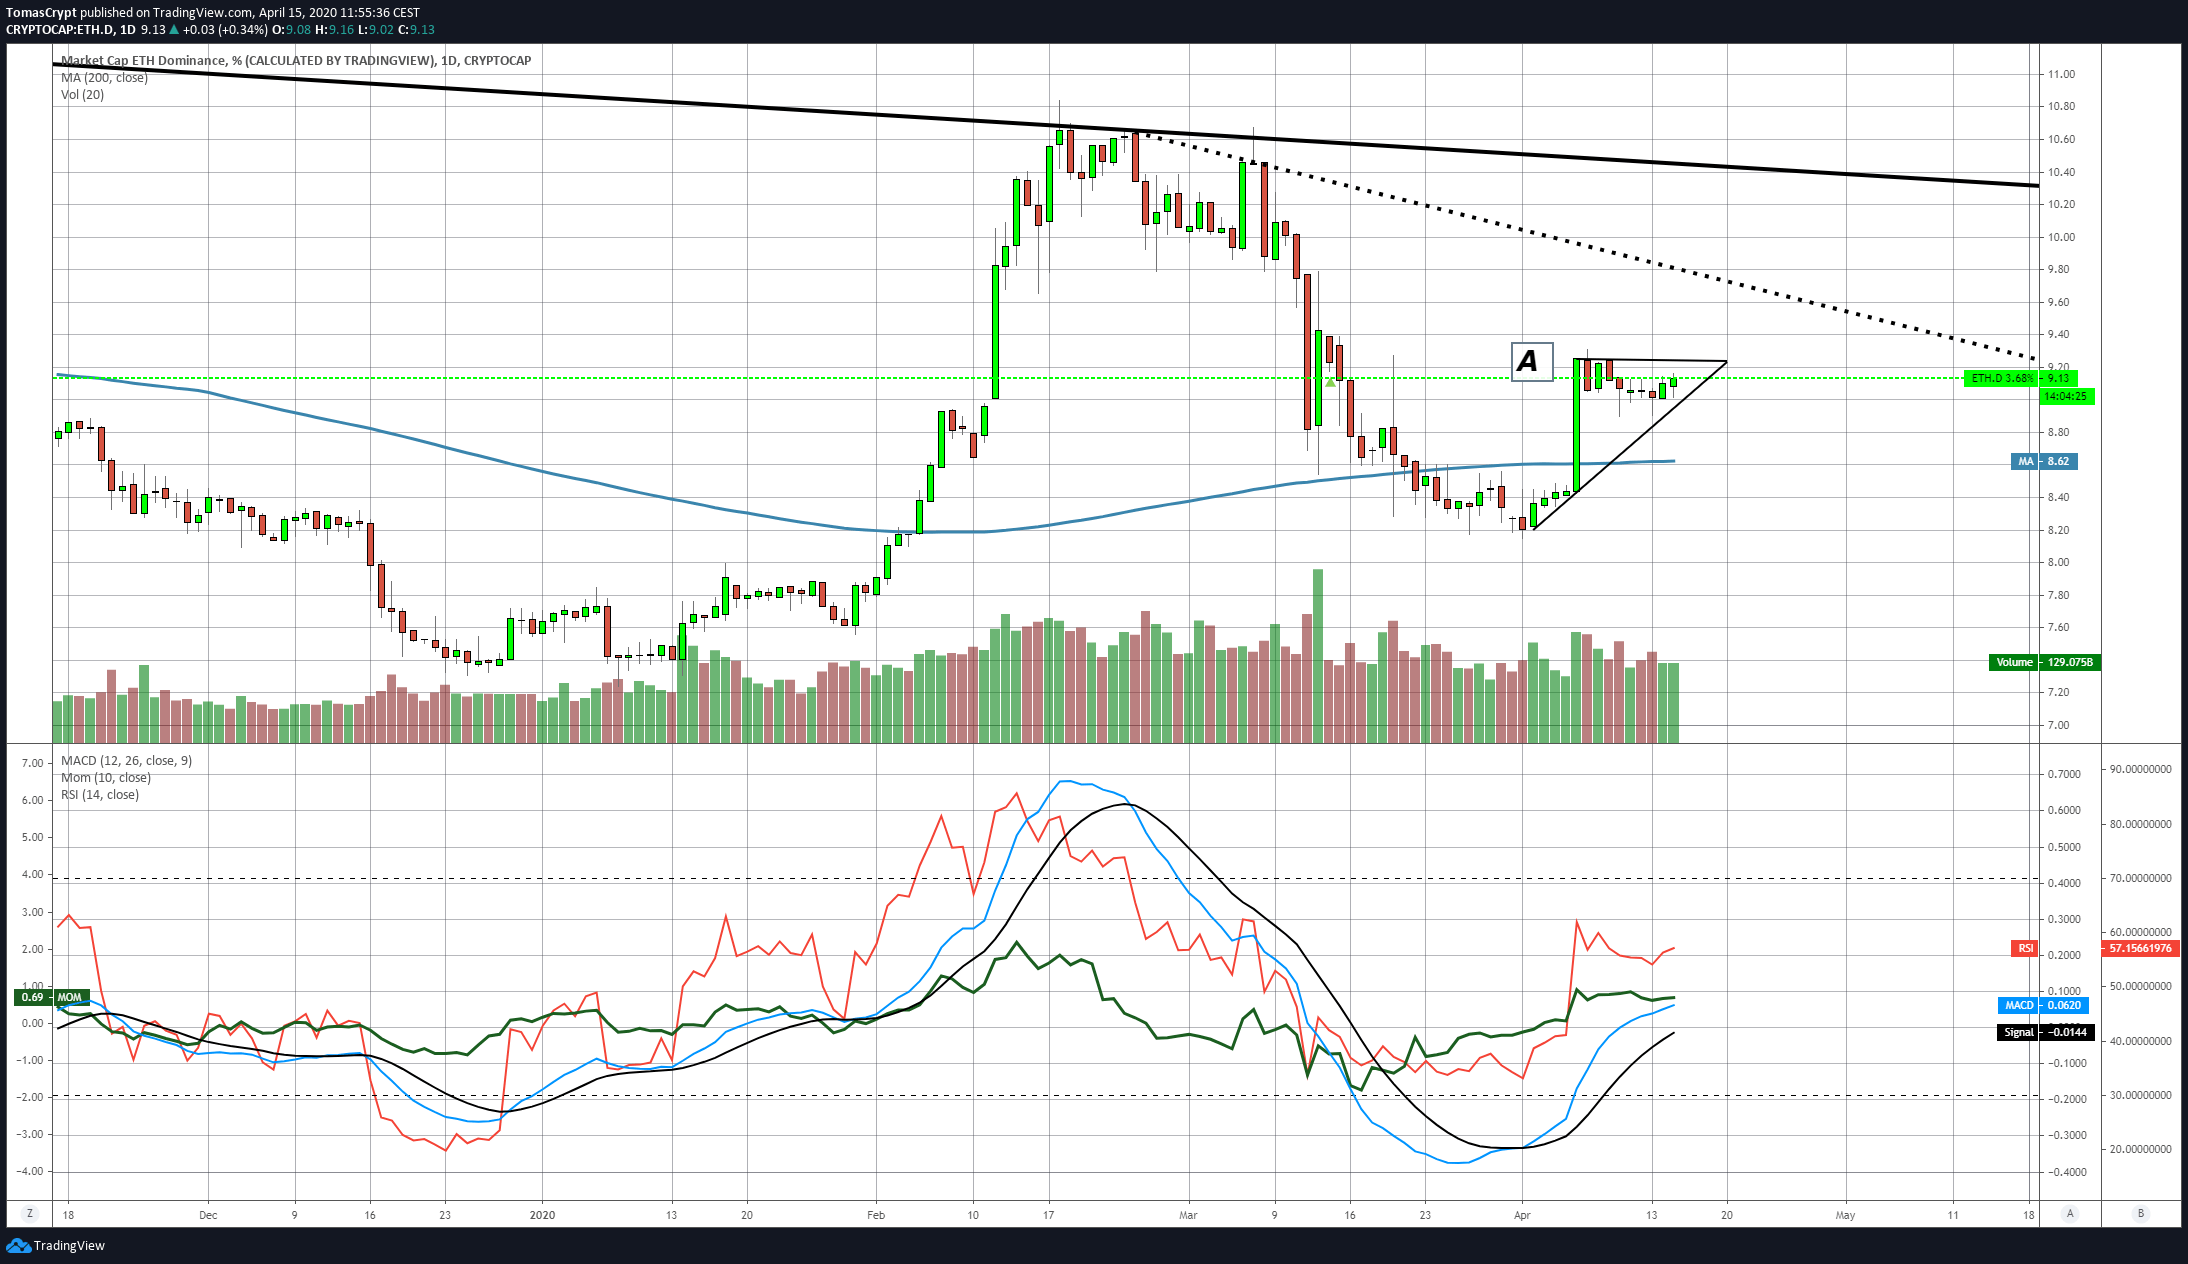
The Momentum indicator and the RSI are both moving upward, confirming the clear upward structure of the MACD.
The technical indicator that I am hesitating about is the Momentum indicator as, even though it is tilted upwards, it is very close to MACD's fast average. If it crosses it downwards, it will cancel out the upward opportunity for the Altcoin segment.
I am a believer that the Altcoin segment triggers an uptrend when Altcoins do better than Bitcoin, while when the King of cryptocurrencies does better than Altcoins, it is from its role as the segment's safe-haven value.
The market sentiment indicator prepared by alternative.me today points to level 18, still at the "Extreme Fear" level but improving from previous days.

ETH/BTC Daily Chart
The ETH/BTC pair is currently trading at the price level of 0.02319 and is up 0.58%, which is positive but insufficient to escape the attraction of the price congestion support level of 0.0228.
Above the current price, the first resistance level is at 0.0245, then the second at 0.0255 and the third one at 0.0268.
Below the current price, the first support level is at 0.0228, then the second at 0.0225 and the third one at 0.022. The density of support for the ETH/BTC pair is high, which should be a safety net for bulls.
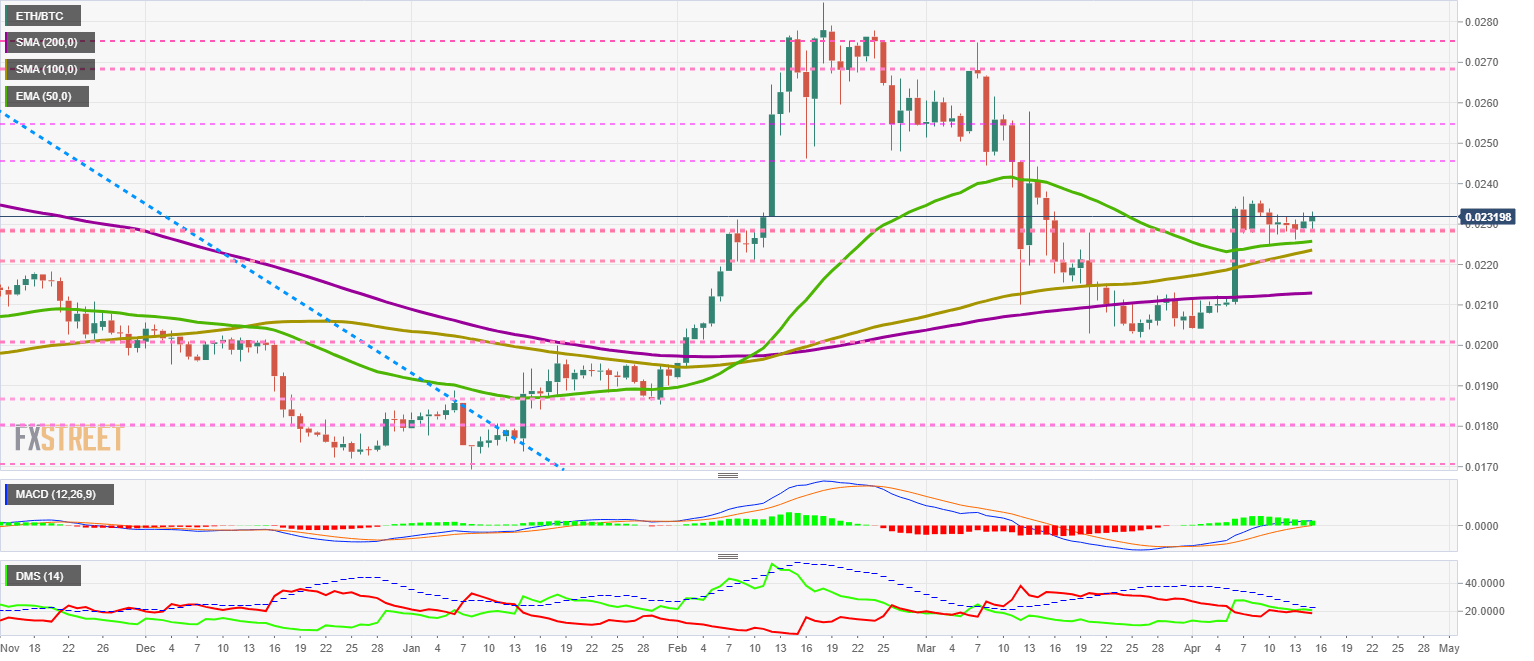
The MACD on the daily chart continues to show a very flat profile but is already moving entirely in the positive zone of the indicator. A typical move would be a test between the indicator's moving averages and then continue with the upward trajectory.
The DMI on the daily chart shows bulls with a small advantage over the bears. The presence of the ADX line just above the buyers' level limits the development. The market direction will only be confirmed when the upward break of the trend strength indicator occurs.
BTC/USD Daily Chart
The BTC/USD pair is currently trading at the $6845 price level and is holding on to the last reliable support level before it can attack the long-term downward sloping channel ceiling.
Above the current price, the first resistance level is at $7100, the second at $7350 and the third one at $7600.
Below the current price, the first support level is at $6850, then the second at $6750 and the third one at $6575.

The DMI on the daily chart shows how bulls and bears have crossed the ADX line sideways, caused by the drop in trend force itself. Episodes of unexpected volatility usually solve this scenario.
ETH/USD Daily Chart
The ETH/USD pair is currently trading at $158.7 and is showing some difficulty in moving forward in light of the 50-day exponential moving average. The main moving averages move within a range of $163 to $182.
Above the current price, the first resistance level is at $163, then the second at $171 and the third one at $183. I think it is essential to note that each moving average moves through a level also marked as price congestion resistance, thus increasing the difficulty of the resistance level.
Below the current price, the first support level is at $155, then the second at $142 and the third one at $130.
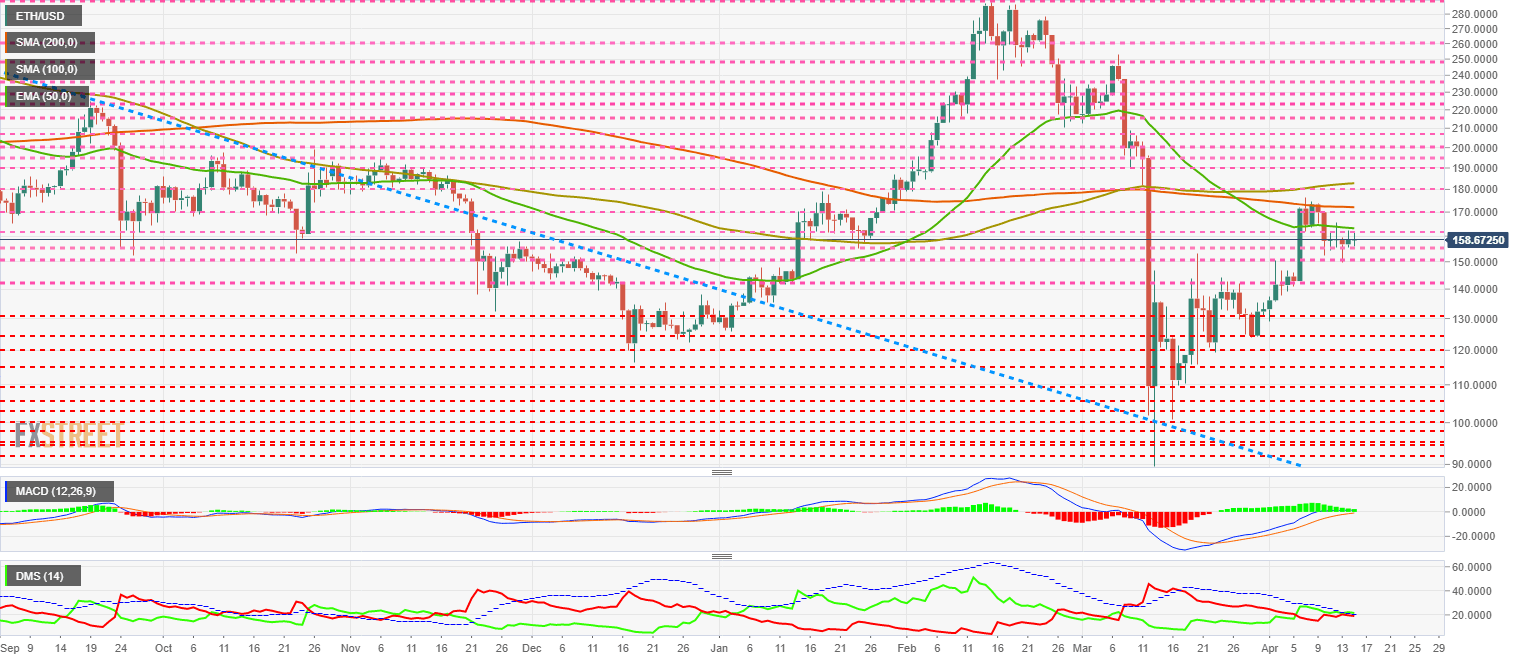
The DMI on the daily chart shows that bears and bulls are in the process of repeating what I have already detailed for the BTC/USD pair. The causes and consequences of this technical structure are the same.
XRP/USD Daily Chart
The XRP/USD pair is currently trading at the price level of $0.187 and like the ETH/USD pair is unable to break out of the pattern of the leading moving averages and price congestion resistance.
Above the current price, the first resistance level is at $0.194, then the second at $0.20 and the third one at $0.22.
Below the current price, the first level of support is at $0.175, then the second at $0.172 and the third one at $0.15.

The DMI on the daily chart shows bears and bulls moving together in their cross of the ADX line. The drop in trend force has caused a lateral cross of the ADX line, sudden increases in volatility usually resolve this pattern.
Get 24/7 Crypto updates in our social media channels: Give us a follow at @FXSCrypto and our FXStreet Crypto Trading Telegram channel
Author

Tomas Salles
FXStreet
Tomàs Sallés was born in Barcelona in 1972, he is a certified technical analyst after having completing specialized courses in Spain and Switzerland.


