Top 3 Price Prediction Bitcoin, Ether, Ripple: Crypto starship starts the engines, pointing beyond limits
- The bullish scenarios are fulfilled and bring the Top 3 to the launch pad.
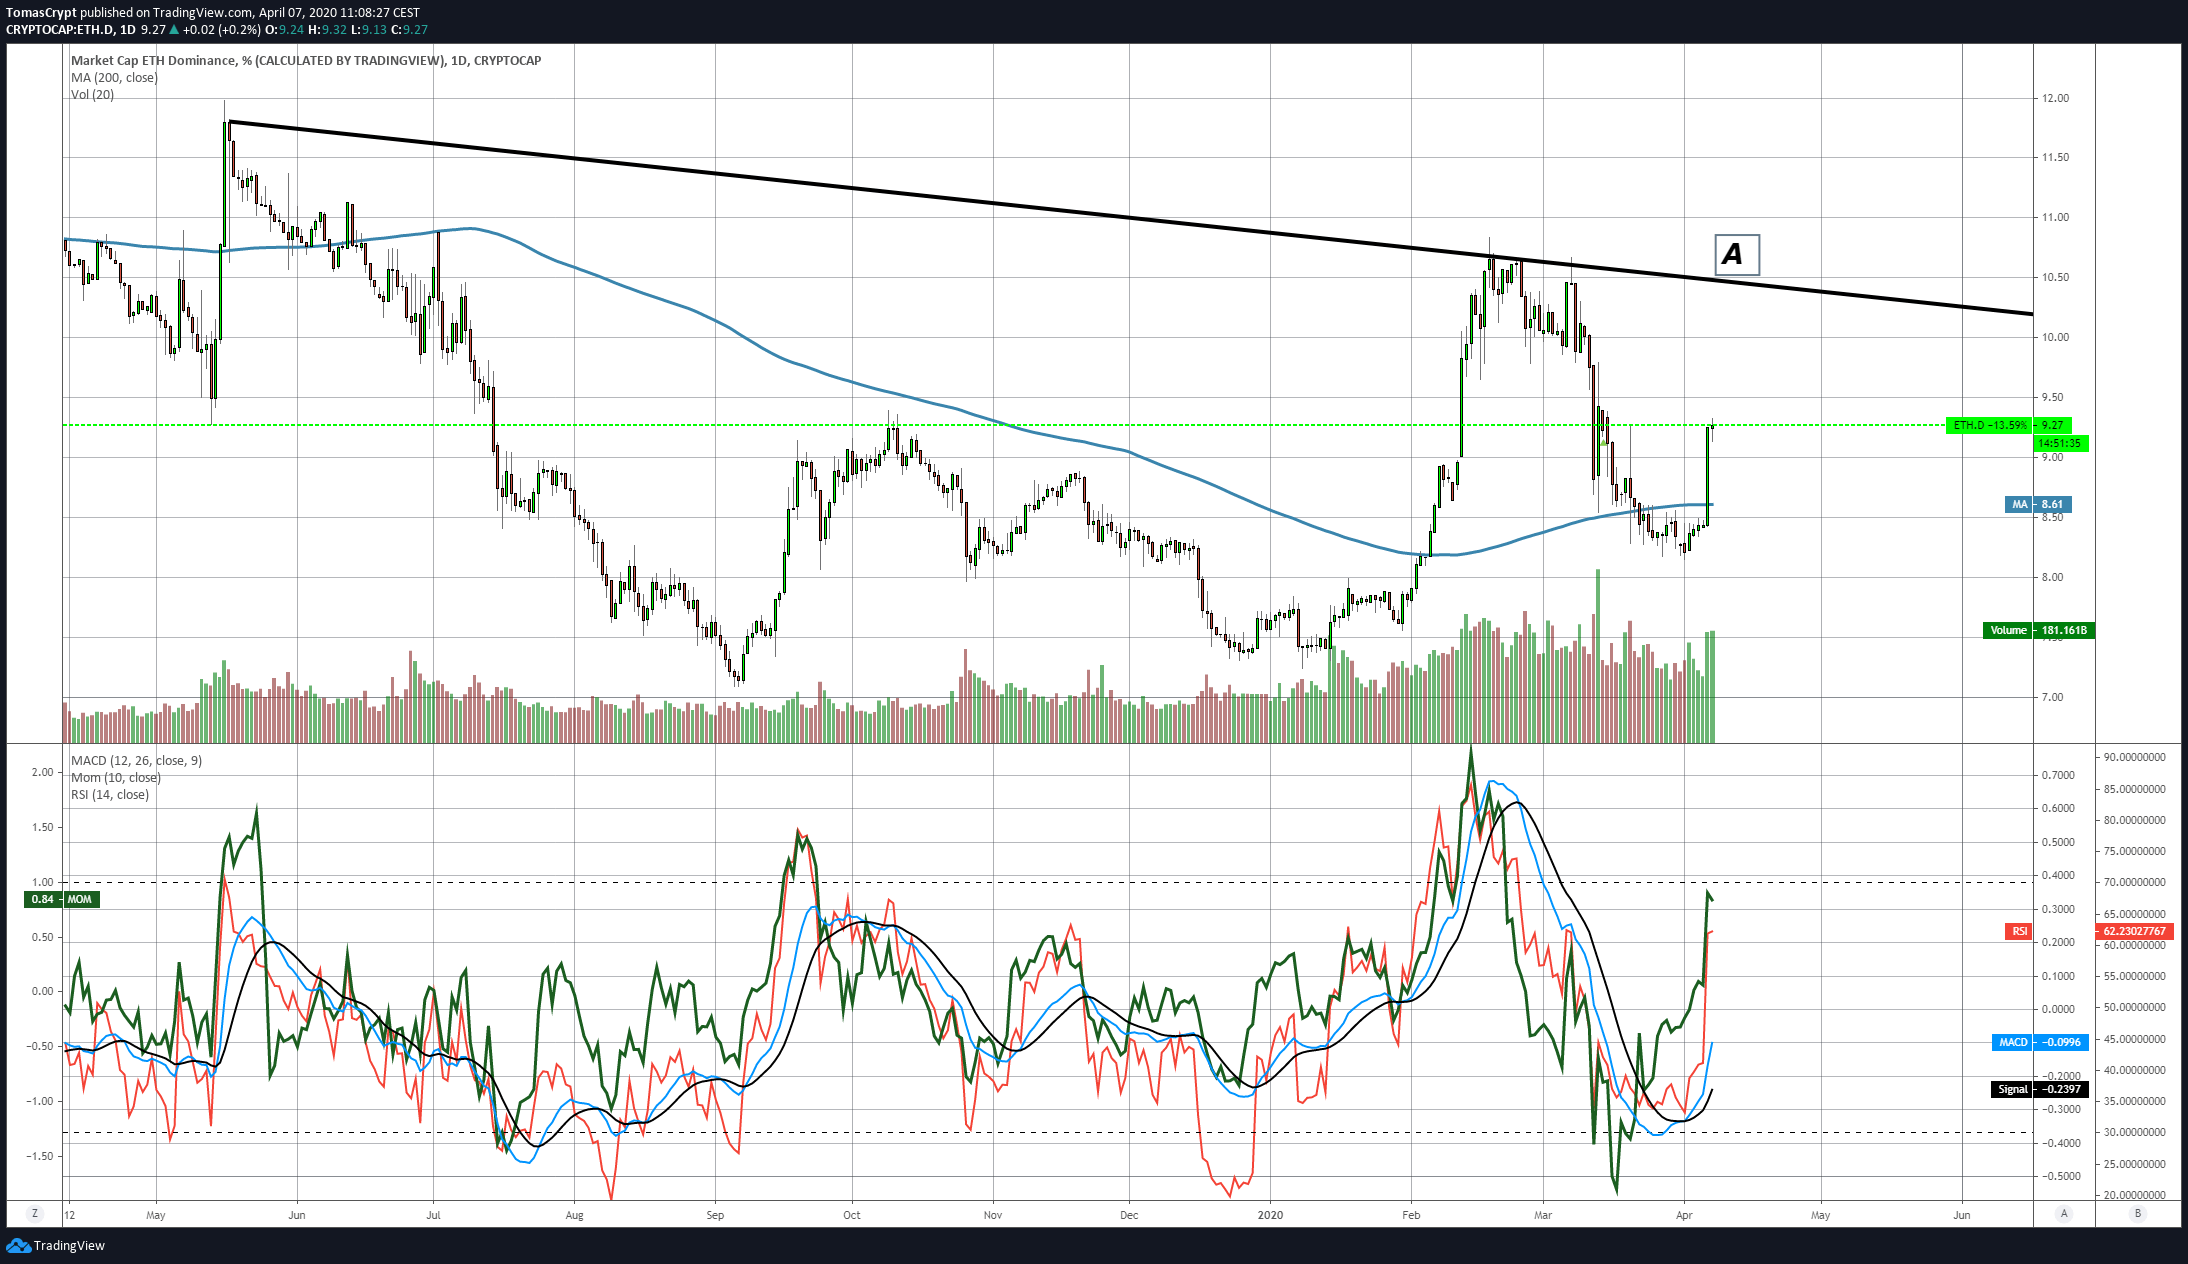
- Ether's dominance shoots up and improves by more than 10% in a single day.
- The movement shows strong potential not seen since the 2017 bump.

Yesterday, Ether made a strong impact and shot its dominance level up 10%, easily surpassing the SMA200 and registering one of the most significant upward movements in one day since records began.
The magnitude of the movement is essential, but even more critical is the impact on the scenarios than can develop the components of the Top 3 from here.
The Ether Dominance chart is currently trading at the price level of 9.22 and has significant resistance to the long-term downward trend line (A) that would pass through the 10.40 level.
The crypto market should continue to move higher until the Ether Dominance level arrives at the trend line level. If the movement stops and falls, the upward momentum is over. If the Ether's Dominance chart manages to break through that downward trend line (A), the moon will be just a stop on the crypto trip beyond the solar system.
The ETH/BTC chart moved sharply up yesterday and pulverized the resistance of the leading moving averages without any problems. This crypto pair is a direct result of the market, and its trend sets the pace for the entire cryptocurrency segment.
ETH/BTC Daily Chart
The ETH/BTC pair is currently trading at the price level of 0.0234 and is well above the major moving averages. In Europe, the day is starting with little movement, which is normal after yesterday's steady rise.
Today's trading may see some selling in favour of the Bitcoin, looking for support at the 0.0225 level.
Above the current price, the first resistance level is at 0.025, then the second at 0.0268 and the third one at 0.0275.
Below the current price, the first current support level is at 0.0228, then the second at 0.0225 and the third one at 0.0215.

The MACD on the daily chart shows a significant improvement in the bullish profile, both in opening and in rising trends. The presence of the neutral level of the MACD indicator will act as technical resistance, but with this profile, it should not be a significant problem.
The DMi on the daily chart shows how the bulls are taking control of the situation forcefully, but are still moving below the ADX line. Until the D+ is above this trend force indicator, the bullish pattern will not be activated, which would indicate, if this scenario comes true, then the bullish potential is enormous.
BTC/USD Daily Chart
The BTC/USD pair is currently trading at $7352 and has managed to break through the long-term bearish channel ceiling and also the EMA50. Yesterday's upward movement has changed the scenario to one of neutrality. The full bullish scenario is above the $8150 price level.
Above the current price, the first resistance level is at $7450, then the second at $7600 and the third one at $7725.
Below the current price, the first support level is at $7250, then the second at $7140 and the third one at $6880.

The DMI on the daily chart shows how bears manage to break the ADX line and activate a bullish pattern that gives significant support to the general market momentum.
ETH/USD Daily Chart
The ETH/USD pair is currently trading at $172.5 following yesterday's sharp rise. Despite conquering the $170 level and breaking the EMA50, the ETH/USD couldn't break the SMA200. The scene for the Ether is very bullish, so it could achieve this milestone even as I conclude this article.
Above the current price, the first resistance level is at $180, then the second at $190 and the third one at $195.
Below the current price, the first support level is at $170, then the second at $160 and the third one at $155.

The current setup suggests an upside cross without too much trouble for the ETH/USD pair.
The DMI on the daily chart shows that bulls are taking control of the ETH/USD pair but limited by the presence of the ADX line in the short term. The ETH/USD will not enter a full bullish phase until it crosses this trend line.
XRP/USD Daily Chart
The XRP/USD pair is currently trading at the price level of $0.2002 after climbing above the EMA50 and the psychological level of $0.20 yesterday.
Above the current price, the first resistance level is at $0.218, then the second at $0.223 and the third one at $0.24.
Below the current price, the first support level is at $0.196, then the second at $0.19 and the third one at $0.178.

The DMI on the daily chart shows how the bulls are crossing the ADX line and therefore activating the medium-term bullish pattern.
Get 24/7 Crypto updates in our social media channels: Give us a follow at @FXSCrypto and our FXStreet Crypto Trading Telegram channel
Author

Tomas Salles
FXStreet
Tomàs Sallés was born in Barcelona in 1972, he is a certified technical analyst after having completing specialized courses in Spain and Switzerland.


