Top 3 Prediction Bitcoin, Ripple, Ethereum: IRS focused on cryptocurrency tax cheats, ETH reclaims $4,000
- Bitcoin price reaches a stalemate between buyers and sellers.
- Ethereum price regains bullish posture and $4,000 with a 10% gain.
- Ripple price staggered, attempts to bounce from important tactical price level.

Bitcoin price may have survived the first test at the head-and-shoulders neckline, but the resulting doji candle speaks to indecision. Ethereum price once again shakes off the broader weakness in the cryptocurrency market, eager to continue the seven-week rally. Ripple price strikes support at the 50-day simple moving average (SMA).
Cryptocurrency investors beware, the IRS is coming for you
Currently, brokerage firms must report stock sales and related information to the Internal Revenue Service (IRS) to evaluate tax compliance. Still, there is no similar comparable reporting process for cryptocurrency exchanges. The lack of reporting makes crypto investing more attractive to criminals and for tax evasion.
In 2014, the IRS defined digital currencies as property, not like fiat currencies such as the US dollar or Japanese yen. Instead, they are considered to be property like equities. If an owner of cryptocurrencies holds a position for longer than a year, the profit will be regarded as a long-term capital gain and, as a result, taxed lower than ordinary income. Conversely, if the owner liquidates the digital token in less than a year, it falls under the short-term capital gain tax, which is the same as wages. Thus, the sales or exchanges of cryptocurrencies are taxable transactions.
The IRS has launched two initiatives to identify crypto tax evaders. In April and May of this year, the tax collection agency received approval from a federal judge in Boston and San Francisco to summon the records of the cryptocurrency exchange Kraken and the payments company, Circle. Each summons hopes to be the leverage the IRS needs to find the information it can’t get otherwise. According to Acting Assistant Attorney General David A. Hubbert of the Justice Department’s Tax Division, “those who transact with cryptocurrency must meet their tax obligations like any other taxpayer.”
It is not the first time the IRS received approval for summons. In 2016 it was allowed to obtain information for approximately 13,000 customers of Coinbase Global. With the data, the IRS forwarded letters to most insisting that they pay their cryptocurrency taxes. As a result, almost 10% of the customers submitted new tax returns, generating millions for the IRS.
The IRS has instituted other initiatives, but the basic message for cryptocurrency investors in Bitcoin, Ether and Ripple is that the IRS will aggressively enforce tax law as stipulated and continue to explore further avenues to pull the curtain back on a relatively private area of the financial markets.
Bitcoin price stabilizes after double-digit decline
In an FXStreet article published on May 11, a complex topping process beginning in March was revealed, highlighted by a head-and-shoulders pattern on the 12-hour Bitcoin price chart. It was anticipated that the pattern would resolve to the downside, grabbing the attention of investors and putting the bullish narrative for the pioneer cryptocurrency in doubt.
On the same day, Bitcoin price sliced below the 50 twelve-hour (SMA) and the 200 twelve-hour SMA delivering a -12.8% blow to the bottom line of BTC investors and the largest one-day decline since January 21.
Yesterday, Bitcoin price arrested the decline, just before reaching the neckline of the head-and-shoulders pattern. BTC closed the day with a long-legged doji on the daily chart, highlighting an intense struggle between buyers and sellers.
A long-legged doji consists of long upper and lower shadows with the opening and closing prices approximately the same. The candle pattern reflects indecision about the future of the market. It confirms that the forces of supply and demand are near equilibrium, alerting investors to a possible change in sentiment. Its significance is elevated when it occurs following a substantial advance or decline and on longer-term charts.
Moving forward, investors should anticipate a brief consolidation as the Bitcoin price compression from the decline is removed while remaining alert to a trade above the high or below the low of the doji candle.
A test of the low would signal that Bitcoin price is ready to undercut the neckline and begin an extended decline to the head-and-shoulders measured move target of $33,825, yielding a loss of 25% from the neckline.
In the path to the measured move target of the head-and-shoulders pattern is the 38.2% Fibonacci extension of the March 2020-April 2021 rally at $41,581, followed by the strategic 200-day SMA at $39,071. One last obstacle is the 50% retracement at $34,378.
It is important to note that a “Death Cross” is approaching on the 12-hour chart, as the 50 twelve-hour SMA at $54,761 is edging closer to the 200 twelve-hour SMA at $53,760. An important addition to the bearish BTC narrative and will be key in identifying price action for all market participants.
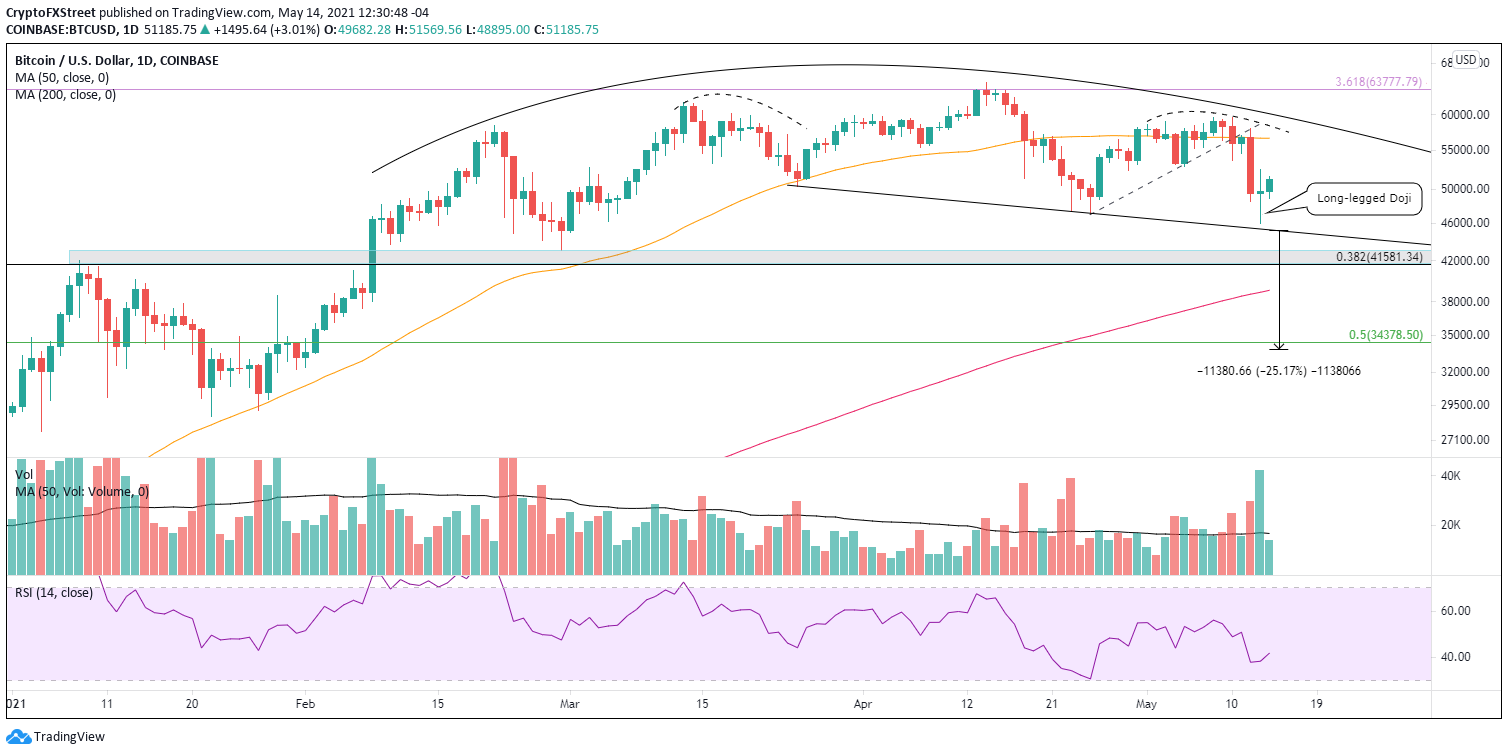
BTC/USD daily chart
A test of the doji candle high at $52,500 would introduce a new opportunity for the bullish narrative and conclude the consolidation of the sharp decline. Investors will discover resistance at the declining 50-day SMA at $56,628 and then the right shoulder high at $59,592, where the head-and-shoulders pattern would be invalidated.
Further upside for BTC would be challenged by the 361.8% extension of the 2017-2018 decline at $63,777, the region of the April high.
Ethereum price in a rush to regain upward momentum
Ethereum price has assembled a seven-week advance, the longest since the December 2019–February 2020 nine-week advance. It is the second-largest seven-week gain since 2018, with a return of over 140%.
Between May 10 and May 12, Ethereum price struggled with the 361.8% Fibonacci extension of the April 22-23 decline at $4,232. Part of the restlessness can be attributed to the magnet effect of large round numbers, in this case, $4,000.
The resistance identified at the extension level combined with the overbought condition of the daily, and weekly Relative Strength Indexes (RSI) ushered in a mild contraction in price. Still, ETH does not appear inclined to decline any more.
The next level of resistance for ETH is the 361.8% extension of the 2018 decline at $4,926, yielding a 20% gain from price at the time of writing.
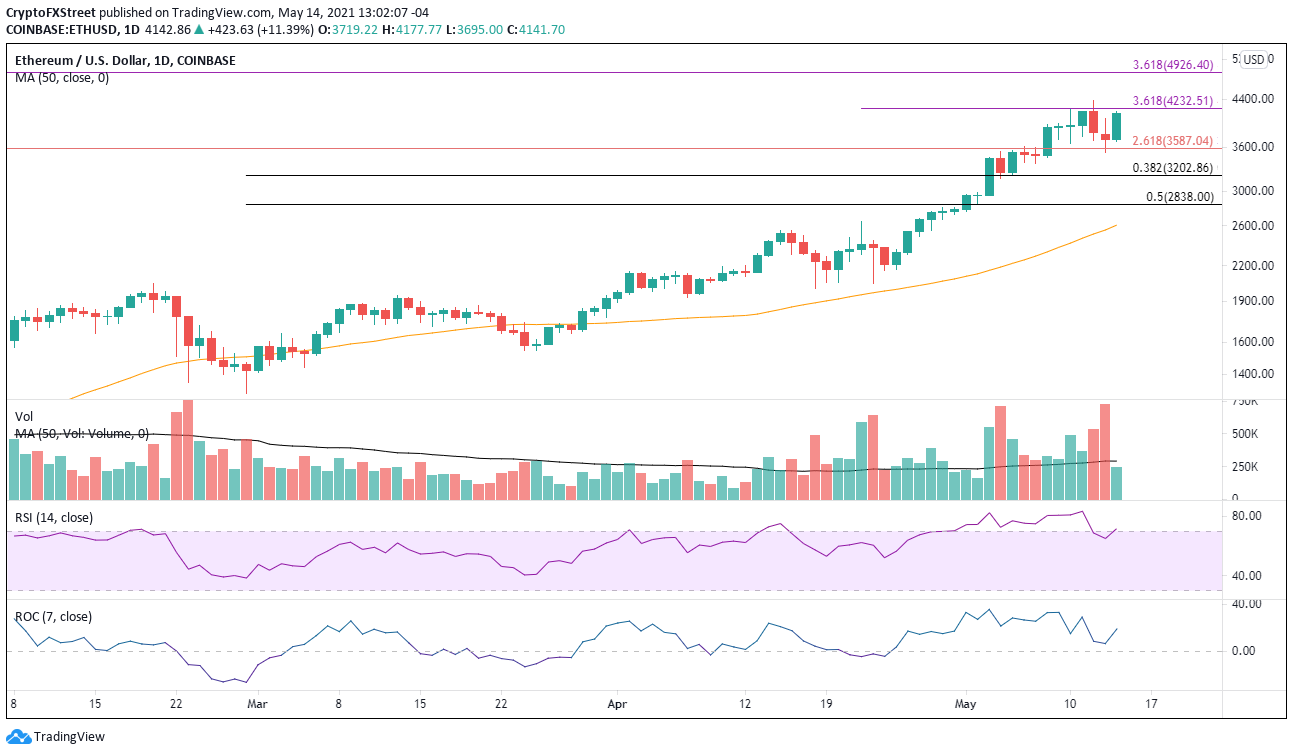
ETH/USD daily chart
Alternatively, Ethereum price could print a marginal new high before kickstarting a substantive correction that may test the 38.2% retracement of the February-May advance at $3,202.
XRP price rebounds with signs of accumulation
On May 10, XRP price triggered a bearish double top pattern with a trade below $1.315 before rebounding for three days on meager volume. On May 12, Ripple revisited the double top trigger, closing with a 14% loss, adding increased pressure on the international settlements token.
XRP price has manufactured a rebound from the tactical 50-day SMA at $1.208, elevating the hopes that Ripple has marked a corrective low.
The outlook remains bearish, with downside targets beginning at the 50% retracement of the 2021 advance at $1.067. The most recognizable support is the psychologically important $1.00.
If Ripple cannot generate a rebound from around $1.00, XRP price will test the support framed by the April low at $0.874 and the 61.8% Fibonacci retracement of the 2021 advance at $0.856. The price range defined by the November 2020 high at $0.780 and the February high at $0.757 should arrest any residual selling pressure.
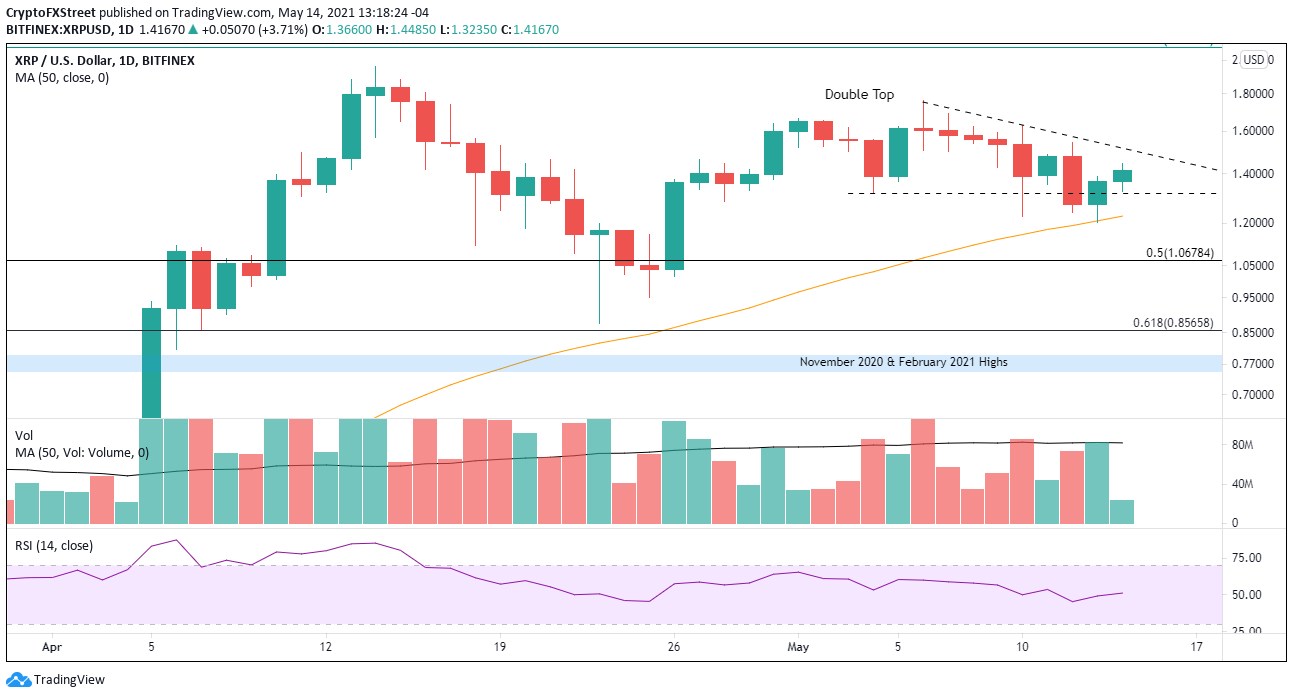
XRP/USD daily chart
To renew a bullish view on Ripple, XRP price needs to rally above the minor trendline at $1.516 and the May 12 high at $1.547.
Author

Sheldon McIntyre, CMT
Independent Analyst
Sheldon has 24 years of investment experience holding various positions in companies based in the United States and Chile. His core competencies include BRIC and G-10 equity markets, swing and position trading and technical analysis.


