- Dogecoin, Shiba Inu and Pepe extend gains on Friday after Thursday’s surge.
- The three meme coins have broken above bullish technical formations, signaling the possibility of further gains ahead.
- The RSI reaches overbought levels for DOGE, SHIB and PEPE, increasing the odds of a corrective pullback.
The prices of the top 3 meme coins by market capitalization, Dogecoin (DOGE), Shiba Inu (SHIB) and Pepe (PEPE), extend their gains on Friday after a rally on Thursday. The technical outlook for the three coins hints at further gains ahead as they all broke above bullish technical patterns.
Dogecoin breaks from wedge
Dogecoin price broke above the falling wedge pattern (drawn by connecting multiple high and low levels with a trendline from early March) on Thursday. As of Friday, it continues to trade higher, around $0.123, the highest level since the beginning of August.
If the breakout level of around $0.115 holds as support, DOGE could rally 15% to retest its daily resistance level at $0.141.
The Moving Average Convergence Divergence (MACD) indicator supports Dogecoin’s rise after posting a bullish crossover on the daily chart on September 9. Additionally, green histogram bars are rising and above the neutral line zero, suggesting the continuation of upward momentum.
However, the Relative Strength Index (RSI) is nearing the overbought level of 70. If it enters the zone on a closing basis, traders will be advised not to add to their long positions as the chances of a price pullback increase. Another option is that the rally continues, and the RSI climbs further up into overbought and remains there.
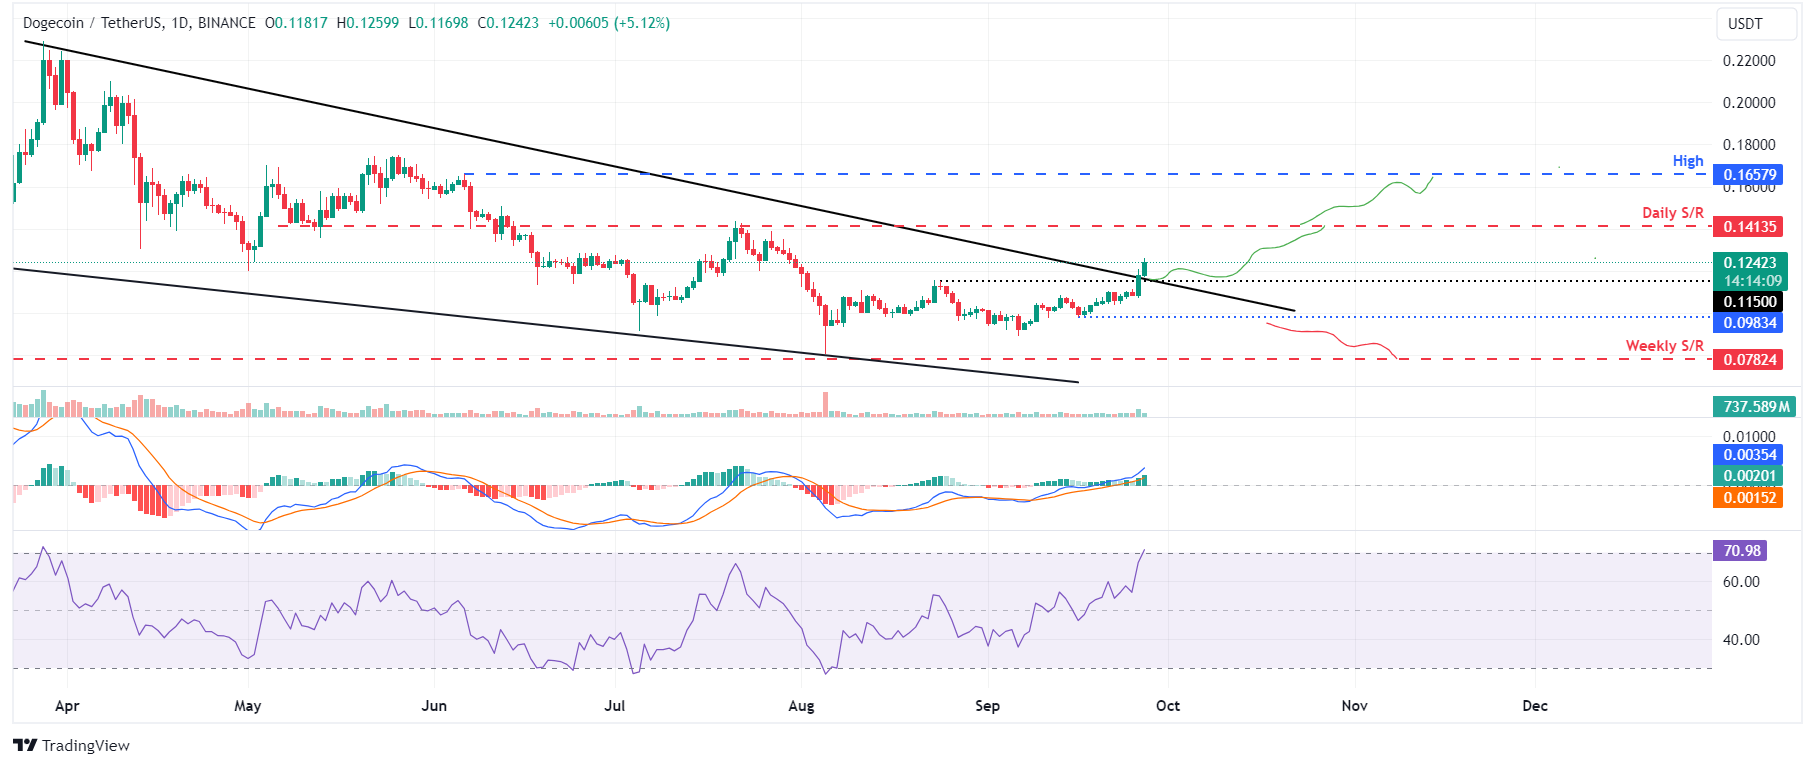
DOGE/USDT daily chart
On the other hand, If Dogecoin fails to find support around the breakout level of around $0.115 and continues to decline to close below the September 16 low of $0.098, the bullish thesis would be invalidated. This development would extend the decline to retest its weekly support level at $0.078.
Shiba Inu price hold gains from Thursday’s 22% surge
Shiba Inu’s price broke above the symmetrical triangle on September 20 and rallied 29% in the next six days. On Thursday, it also closed above its weekly resistance level at $0.000016. As of Friday, it continues to trade higher around $0.000019.
If the weekly resistance level at $0.00016 holds as support, SHIB could continue its rally from its current trading level to retest its September 16 high of $0.000020.
If the bulls are aggressive and SHIB closes above $0.000020. It would extend the rally by 15% to retest its technical target of the symmetrical triangle pattern (obtained by measuring the distance between the first daily high and the first daily low to the breakout point) at $0.000023.
The MACD indicator on the daily chart supports SHIB’s rise after the bullish crossover seen on September 10, when the. The MACD line (blue line) moved above the signal line (yellow line). Green histogram bars are also rising above the neutral line zero.
However, the Relative Strength Index (RSI) stands at 80, trading above its overbought level of 70. Traders should be cautious and will be advised not to add to their long positions because the chances of a price pullback are increasing.
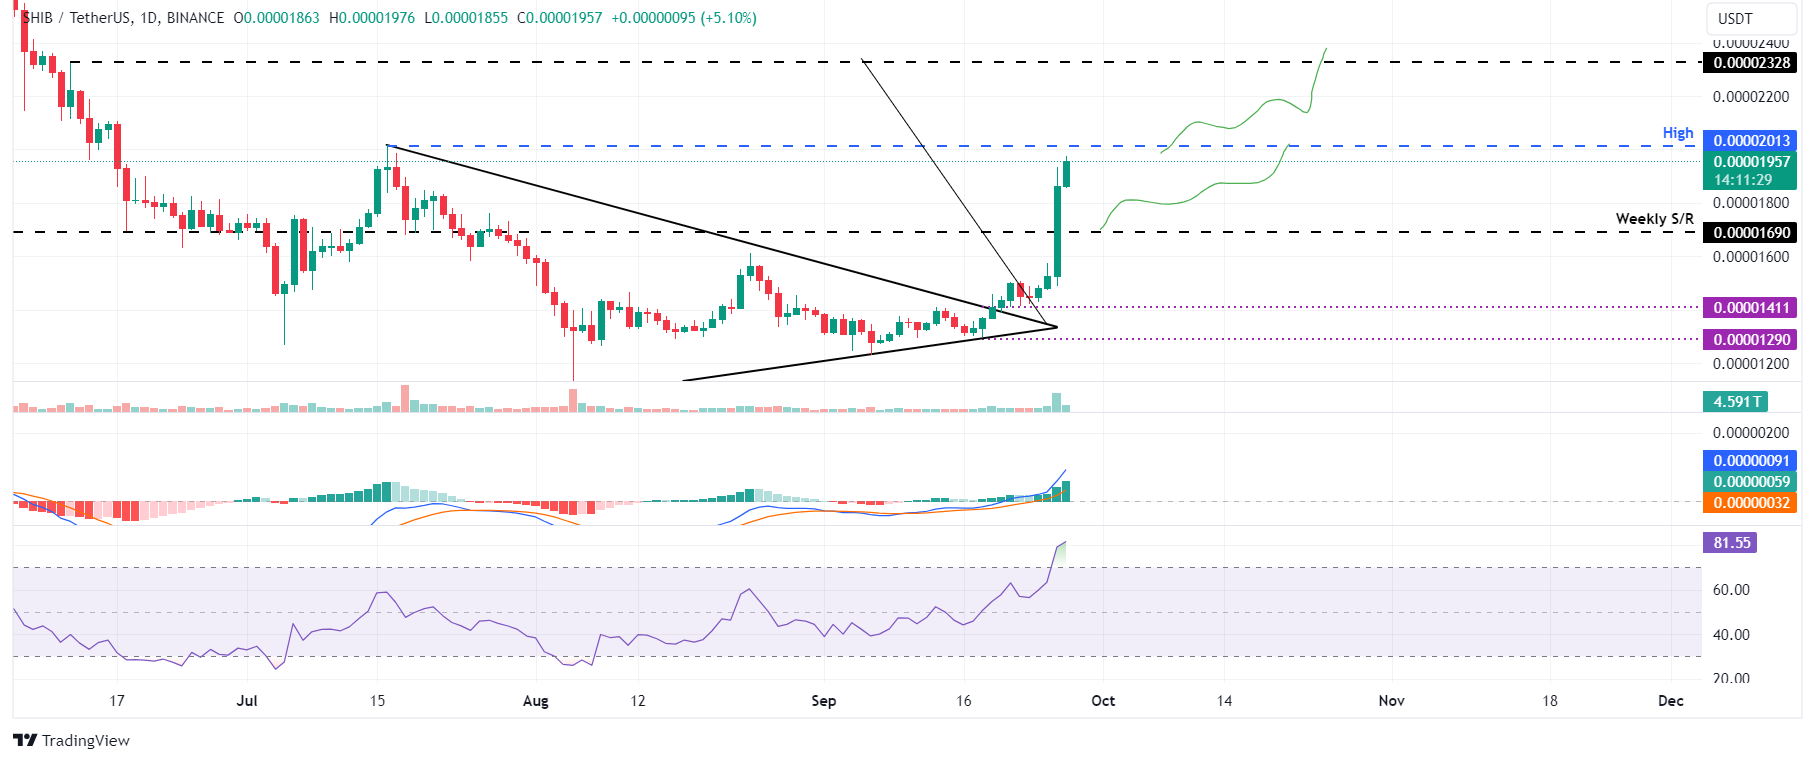
SHIB/USDT daily chart
However, if SHIB’s weekly level at $0.00016 fails to hold and its daily candlestick closes below the breakout level of $0.000014, the market structure would change from bulls to bears. This scenario would extend the decline to retest its September 18 low of $0.000012.
PEPE bulls remain strong
Pepe price broke above the descending trendline (drawn by joining multiple high levels from the end of July to mid-September) on September 20 and rallied 14.5% in the next six days. As of Friday, it continues to trade higher by 12% at $0.0000106, above its 61.8% Fibonacci retracement level at $0.0000104.
If PEPE closes above its 61.8% Fibonacci retracement level at $0.0000104, it could continue to rally 23% from its current trading level to retest its July 24 high of $0.0000131.
The MACD indicator on the daily chart supports PEPE’s price rise after seeing a bullish crossover on September 10. As it is occurring with DOGE and SHIB, green histogram bars are rising above the neutral line zero, which suggests the bulls are in control.
The Relative Strength Index (RSI) stands at 74, trading above its overbought level of 70. Traders should be cautious when adding to their long positions as the chances of a price correction are increasing.
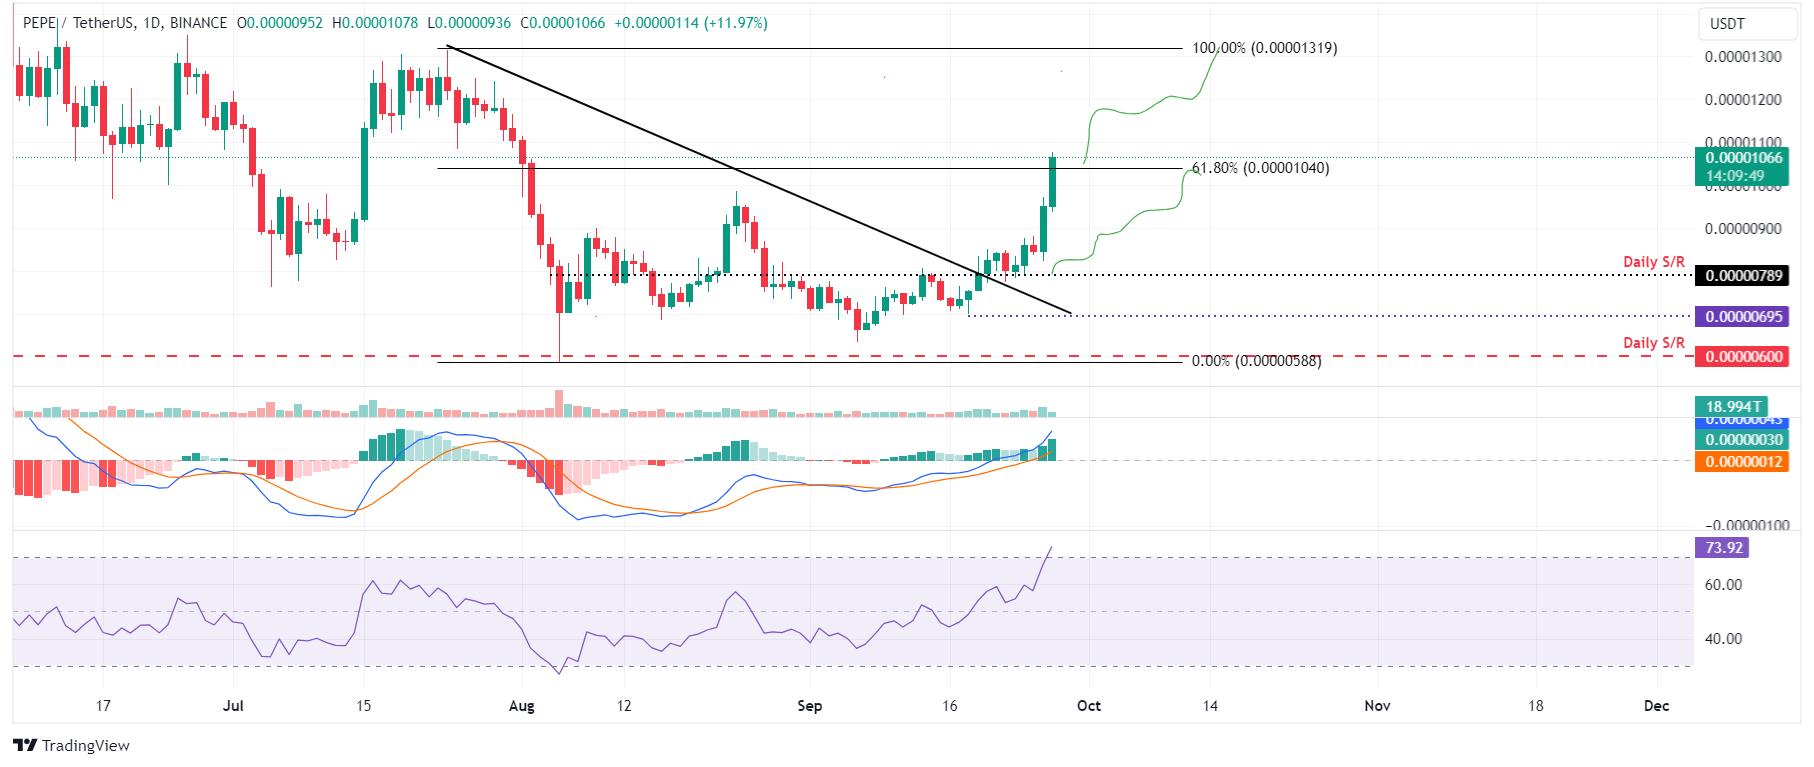
PEPE/USDT daily chart
If Pepe’s daily candlestick closes below $0.0000078, it would form a lower low on the daily time frame, thus invalidating the bullish thesis. This would extend Pepe’s decline to retest its September 18 low of $0.0000069.
Information on these pages contains forward-looking statements that involve risks and uncertainties. Markets and instruments profiled on this page are for informational purposes only and should not in any way come across as a recommendation to buy or sell in these assets. You should do your own thorough research before making any investment decisions. FXStreet does not in any way guarantee that this information is free from mistakes, errors, or material misstatements. It also does not guarantee that this information is of a timely nature. Investing in Open Markets involves a great deal of risk, including the loss of all or a portion of your investment, as well as emotional distress. All risks, losses and costs associated with investing, including total loss of principal, are your responsibility. The views and opinions expressed in this article are those of the authors and do not necessarily reflect the official policy or position of FXStreet nor its advertisers. The author will not be held responsible for information that is found at the end of links posted on this page.
If not otherwise explicitly mentioned in the body of the article, at the time of writing, the author has no position in any stock mentioned in this article and no business relationship with any company mentioned. The author has not received compensation for writing this article, other than from FXStreet.
FXStreet and the author do not provide personalized recommendations. The author makes no representations as to the accuracy, completeness, or suitability of this information. FXStreet and the author will not be liable for any errors, omissions or any losses, injuries or damages arising from this information and its display or use. Errors and omissions excepted.
The author and FXStreet are not registered investment advisors and nothing in this article is intended to be investment advice.
Recommended Content
Editors’ Picks
Ripple update: XRP shows resilience in recent crypto market sell-off
Ripple's XRP is up 6% on Tuesday following a series of on-chain metrics, which reveals investors in the remittance-based token held onto their assets despite the wider crypto market sell-off last week.
Floki DAO floats liquidity provisioning for a Floki ETP in Europe
Floki DAO — the organization that manages the memecoin Floki — has proposed allocating a portion of its treasury to an asset manager in a bid to launch an exchange-traded product (ETP) in Europe, allowing institutional investors to gain exposure to the memecoin.

Six Bitcoin mutual funds to debut in Israel next week: Report
Six mutual funds tracking the price of bitcoin (BTC) will debut in Israel next week after the Israel Securities Authority (ISA) granted permission for the products, Calcalist reported on Wednesday.

Crypto Today: BTC hits new Trump-era low as Chainlink, HBAR and AAVE lead market recovery
The global cryptocurrency market cap shrank by $500 billion after the Federal Reserve's hawkish statements on December 17. Amid the market crash, Bitcoin price declined 7.2% last week, recording its first weekly timeframe loss since Donald Trump’s re-election.

Bitcoin: 2025 outlook brightens on expectations of US pro-crypto policy
Bitcoin price has surged more than 140% in 2024, reaching the $100K milestone in early December. The rally was driven by the launch of Bitcoin Spot ETFs in January and the reduced supply following the fourth halving event in April.

Best Forex Brokers with Low Spreads
VERIFIED Low spreads are crucial for reducing trading costs. Explore top Forex brokers offering competitive spreads and high leverage. Compare options for EUR/USD, GBP/USD, USD/JPY, and Gold.