- Yearn.finance sellers are putting intense pressure on key support levels as losses to $16,000 linger.
- UniSwap could resume the uptrend if the TD Sequential indicator's buy signal is validated.
- UMA's downtrend is far from over, as highlighted by the mega declines in exchange inflows.
It is no doubt that this week has been a trying time in the cryptocurrency industry. Selling pressure dominated most of the trading across the board, except for the top three gainers of the week. Regulatory bodies in the United States went after BitMEX for offering the trading of unregistered derivatives to people in the country. Moreover, the US President, Donald Trump, tested positive for COVID-19 and has been hospitalized for treatment.
Decentralized finance (DeFi) tokens came out as the biggest losers over the last seven days. Among the top 50 digital assets, Yearn.finance (YFI) posted the most significant loss at 43%. UniSwap (UNI) tumbled by over 28% while UMA lost 27% of its value.
Yearn.finance path of least resistance remains downwards
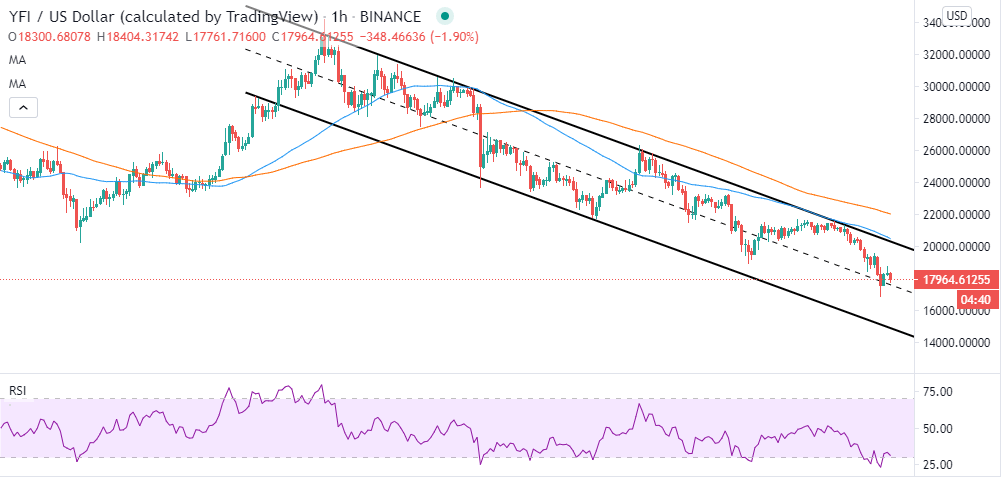
YFI is still the most expensive cryptocurrency one can buy. However, it has lost a great deal of its value since its all-time high of $44,000. The losses occur within a descending parallel channel that refuses to confirm a bull flag pattern. The DeFi token is trading at 18,000 after losing various key support levels, including $22,000 and $20,000.
The losses are likely to continue in the coming sessions, especially if the channel's middle boundary is broken. On the downside, $16,000 is the short term target. The Relative Strength Index (RSI) brings to light the potential for declines materializing as it dips into the oversold region again. On the upside, resistance is expected at $20,000, the 50 Simple Moving Average (SMA) and 100 SMA at $22,000 in the hourly timeframe.
YFI/USD 1-hour chart
IntoTheBlock's IOMAP model reveals increasing resistance heading towards $20,000. However, the most robust hurdle lies between $20,150 and $20,700. Previously, 460 addresses bought 1,300 YFI tokens in that range. It is strong enough to put a stop YFI's recovery. On the downside, the lack of substantial support suggests that the path of least resistance remains to the south. The IOMAP model highlights subtle support between $16,950 and $17,500. Here, 128 addresses previously bought 43 YFI. There is a possibility of the price sliding below this support to refresh levels around $16,000.
YFI IOMAP chart
-637373929889808101.png)
UniSwap ready to reverse the downtrend
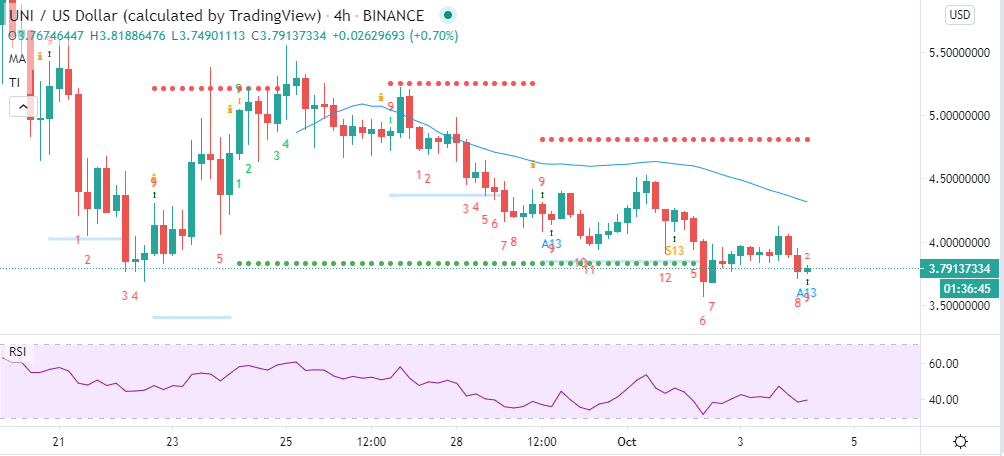
After going through a gruesome week, UniSwap seems ready to bounce off the current support at $3.5. The RSI highlights the possibility of bulls returning into the market as it changes course upwards. Moreover, the TD Sequential indicator is screaming buy after posting a red nine candlestick. However, it is essential to wait for a confirmation of the buy signal before going all-in on UNI. Moreover, resistance is anticipated on the upside at $4, the 50 SMA in the hourly timeframe and the $5 level.
UNI/USD hourly chart
Although the TD Sequential indicator is flashing a buy signal, IntoTheBlock's IOMAP model shows that the path ahead is filled with stumbling blocks. The high concentration of sellers towards $5 is alarming. It is evident that most UNI investors are out of the money because the price dropped massively immediately after they bought in. The biggest hurdle lies between $3.9 and $4. Here, 2,100 addresses bought 25 million UNI. On the flip side, the most formidable resistance lies between $3.4 and $3.5. The region houses roughly 24,000 addresses, which previously bought 14 million UNI.
UniSwap IOMAP chart
-637373930901501848.png)
UMA's woes are far from over
Despite losing more than 27% of its value in the last week, UMA's downtrend appears to be far from over. Support established at $7.2 saw the bulls' return but only for a brief period. The seller congestion at $8 ensured price action to the north did not continue.
UMA/USD 1-hour chart
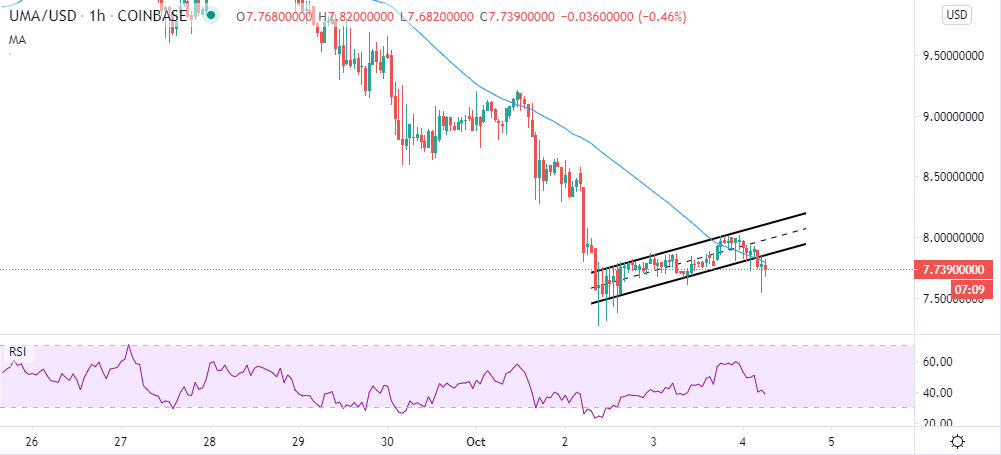
The short-lived recovery also confirmed a bear flag pattern, which currently is the force behind the developing bearish momentum. At the time of writing, UMA is trading at $7.74. The immediate upside is capped by the 50 SMA in the hourly range. Consequently, the RSI highlights the presence of the sellers due to the dip towards the oversold region. Support at $7.5 will likely be retested before recovery comes into the picture.
UMA exchange inflow chart
 [10.05.42, 04 Oct, 2020]-637373931761272679.png)
Santiment, a renowned platform in on-chain metrics, highlights a significant decrease in UMA's exchange inflow. Since the peak, 41,510 UMA in early September, the exchange inflow has reduced significantly. Note that spikes in exchange inflow tend to precede growth in the price of the token. For now, the exchange inflow stands at 4,460 UMA, which emphasizes the selling pressure on the digital assets.
Information on these pages contains forward-looking statements that involve risks and uncertainties. Markets and instruments profiled on this page are for informational purposes only and should not in any way come across as a recommendation to buy or sell in these assets. You should do your own thorough research before making any investment decisions. FXStreet does not in any way guarantee that this information is free from mistakes, errors, or material misstatements. It also does not guarantee that this information is of a timely nature. Investing in Open Markets involves a great deal of risk, including the loss of all or a portion of your investment, as well as emotional distress. All risks, losses and costs associated with investing, including total loss of principal, are your responsibility. The views and opinions expressed in this article are those of the authors and do not necessarily reflect the official policy or position of FXStreet nor its advertisers. The author will not be held responsible for information that is found at the end of links posted on this page.
If not otherwise explicitly mentioned in the body of the article, at the time of writing, the author has no position in any stock mentioned in this article and no business relationship with any company mentioned. The author has not received compensation for writing this article, other than from FXStreet.
FXStreet and the author do not provide personalized recommendations. The author makes no representations as to the accuracy, completeness, or suitability of this information. FXStreet and the author will not be liable for any errors, omissions or any losses, injuries or damages arising from this information and its display or use. Errors and omissions excepted.
The author and FXStreet are not registered investment advisors and nothing in this article is intended to be investment advice.
Recommended Content
Editors’ Picks

Monero Price Forecast: XMR soars over 19% amid rising demand for privacy coins
Monero (XMR) price is extending its gains by 19% at the time of writing on Monday, following a 9.33% rally the previous week. On-chain metrics support this price surge, with XMR’s open interest reaching its highest level since December 20.

Top 3 Price Prediction Bitcoin, Ethereum, Ripple: BTC and ETH stabilize while XRP shows strength
Bitcoin and Ethereum prices are stabilizing at around $93,500 and $1,770 at the time of writing on Monday, following a rally of over 10% and 12% the previous week. Ripple price also rallied 8.3% and closed above its key resistance level last week, indicating an uptrend ahead.

Ethereum Price Forecast: ETH ETFs post first weekly inflows since February
Ethereum (ETH) recovered the $1,800 price level on Saturday after US spot Ether ETFs (exchange-traded funds) recorded their first weekly inflows since February.

Defi Development Corporation files to offer $1 billion in securities to boost its Solana holdings
Defi Development Corporation (formerly Janover) filed a registration statement with the Securities & Exchange Commission (SEC) on Friday, signaling its intent to offer and sell a wide range of securities, including common and preferred stock, debt instruments and warrants for the purchase of equity

Bitcoin Weekly Forecast: BTC consolidates after posting over 10% weekly surge
Bitcoin (BTC) price is consolidating around $94,000 at the time of writing on Friday, holding onto the recent 10% increase seen earlier this week.

The Best brokers to trade EUR/USD
SPONSORED Discover the top brokers for trading EUR/USD in 2025. Our list features brokers with competitive spreads, fast execution, and powerful platforms. Whether you're a beginner or an expert, find the right partner to navigate the dynamic Forex market.