- Monero resumes the uptrend after embracing support at $110.
- Crypto.com appears to have found a market bottom hence the possibility for significant recovery.
- Huobi Token breakdown could be unstoppable following the formation of an ascending wedge.
The cryptocurrency market was a mix of red and green this week amid the 2020 United States presidential elections. Major digital assets like Bitcoin and Ethereum rallied massively. However, some selected altcoins suffered major retracements, including Monero (XMR), Crypto.com (CRO and Huobi Token (HT).
Joe Biden emerged the winner, becoming the 46th president of the US. There has been little market reaction to the news, perhaps because it is a weekend. This article highlights the three biggest losers of the week and what is expected of them in the incoming sessions.
Monero embraces critical support as rebound looms
XMR/USD was recently rejected at $140 after an impressive recovery from September’s support of around $74. A descending parallel channel has highlighted the decline in the last couple of weeks. XMR appears to have found formidable support at $110, hence the ongoing rebound.
The path of least resistance is upwards at the time of writing, reinforced by the Relative Strength Index (RSI). If buy orders increase, Monero will likely extend the bullish leg to the 50 Simple Moving Average. A breakout above the channel could lead to gains targeting $140.
XMR/USD 4-hour chart
It is worth noting that the bullish narrative will be invalidated if XMR resumes the downtrend below the short-term support at $110. Extended losses would seek refuge at $95 before XMR/USD reverses.
Crypto.com Coin recovery in the offing
Crypto.com Coin dropped significantly after its debut in August. The downtrend has become unstoppable, with several buy signals invalidated in the last two months. At the time of writing, CRO is trading at $0.0735 amid the hunt for credible support or bottom.
The Relative Strength Index suggests that a recovery is in the offing, especially after bouncing off the oversold region. If buying pressure behind the token increases in the coming sessions, CRO would rush to the 50 SMA before extending the price action to the 100 SMA.
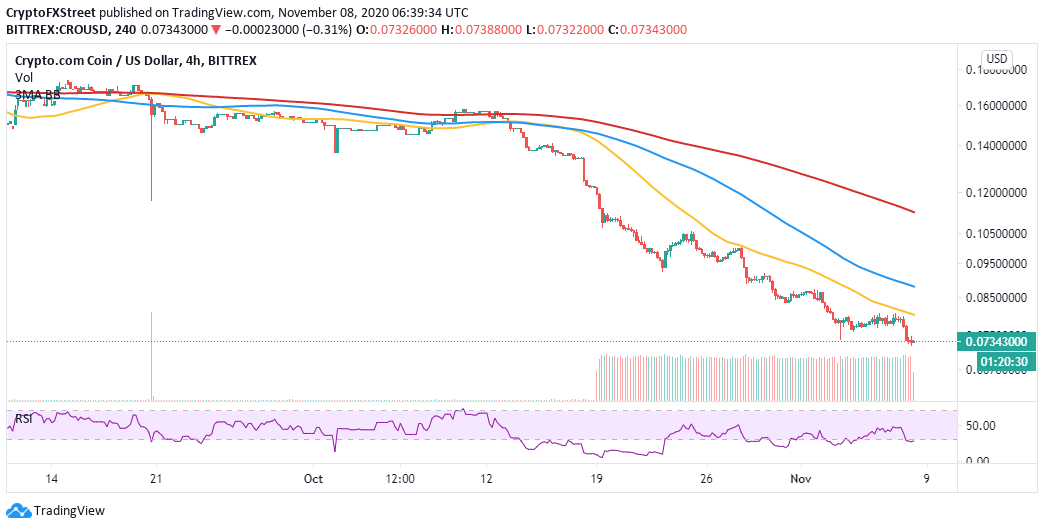
CRO/USD 4-hour chart
The hunt for a bottom will continue if the CRO downtrend resumed below the immediate support. Consolidation is expected to take precedence in the near term, delaying the expected recovery. Moreover, rejection at the 50 SMA might encourage more sellers to join the market, pulling CRO to the next support target at $0.06.
Huobi Token downside unstoppable
Huobi Token recovered remarkably from the recently established support at $3.35. However, a sell signal presented by the TD Sequential indicator on the 4-hour chart absorbed the buying pressure, cutting short the price action under $4.
Currently, HT is changing at $3.75 while dealing with the selling pressure at the 50 SMA. A rising wedge pattern hints at a possible retreat back to the support at $3.35.
HT/USD 4-hour chart
It is worth mentioning that the sell signal will be invalidated if HT breaks above the 50 SMA. A recovery is likely to come into the picture with the upside targeting the 100 SMA, slightly above $4.
Information on these pages contains forward-looking statements that involve risks and uncertainties. Markets and instruments profiled on this page are for informational purposes only and should not in any way come across as a recommendation to buy or sell in these assets. You should do your own thorough research before making any investment decisions. FXStreet does not in any way guarantee that this information is free from mistakes, errors, or material misstatements. It also does not guarantee that this information is of a timely nature. Investing in Open Markets involves a great deal of risk, including the loss of all or a portion of your investment, as well as emotional distress. All risks, losses and costs associated with investing, including total loss of principal, are your responsibility. The views and opinions expressed in this article are those of the authors and do not necessarily reflect the official policy or position of FXStreet nor its advertisers. The author will not be held responsible for information that is found at the end of links posted on this page.
If not otherwise explicitly mentioned in the body of the article, at the time of writing, the author has no position in any stock mentioned in this article and no business relationship with any company mentioned. The author has not received compensation for writing this article, other than from FXStreet.
FXStreet and the author do not provide personalized recommendations. The author makes no representations as to the accuracy, completeness, or suitability of this information. FXStreet and the author will not be liable for any errors, omissions or any losses, injuries or damages arising from this information and its display or use. Errors and omissions excepted.
The author and FXStreet are not registered investment advisors and nothing in this article is intended to be investment advice.
Recommended Content
Editors’ Picks
Ripple on-chain metrics show bullish signs amidst legal struggle with SEC, XRP eyes recovery
![Ripple on-chain metrics show bullish signs amidst legal struggle with SEC, XRP eyes recovery](https://editorial.fxstreet.com/images/Markets/Currencies/Cryptocurrencies/Coins/Ripple/Ripple_Coin_31_02_XtraSmall.jpg)
Ripple made a comeback above $0.48 on Tuesday and hovers above that level in Wednesday’s European session. Ripple on-chain metrics such as transaction volume and Network Realized Profit/Loss have turned bullish, supporting a recovery in the altcoin.
Bitcoin price falls amidst German government transfers, miners activity
![Bitcoin price falls amidst German government transfers, miners activity](https://editorial.fxstreet.com/images/Markets/Currencies/Digital%20Currencies/Bitcoin/bit-coin-symbol-flag-3d-illustration-59931110_XtraSmall.jpg)
Bitcoin (BTC) extends correction on Wednesday and hovers around $61,000 after finding resistance near the $64,000 level on Monday. Recent on-chain data indicates heightened selling activity from Bitcoin miners early in the week.
Crypto Today: Bitcoin erases gains from end of June, Ethereum declines while Ripple holds
![Crypto Today: Bitcoin erases gains from end of June, Ethereum declines while Ripple holds](https://editorial.fxstreet.com/images/Markets/Currencies/Digital%20Currencies/Bitcoin/Bitcoin_2_XtraSmall.jpg)
Bitcoin wipes out gains from the last week of June and falls below $60,000 on Wednesday. Ethereum and top altcoins ranked by market capitalization erased gains as the inflation outlook worsened. Ripple holds on to recent gains and hovers above $0.48 on Wednesday.
Three reasons why altcoins could shake off losses this week
![Three reasons why altcoins could shake off losses this week](https://editorial.fxstreet.com/images/Markets/Currencies/Cryptocurrencies/cryptos_XtraSmall.jpg)
On-chain data from Santiment shows that altcoins are currently in the opportunity zone, or generating buy signals. The top three altcoins in the buy zone are Basic Attention Token (BAT), Chromia (CHR), and Highstreet (HIGH), per Santiment.
Bitcoin: BTC price correction could end in July, according to seasonal data
![Bitcoin: BTC price correction could end in July, according to seasonal data](https://editorial.fxstreet.com/images/Markets/Currencies/Digital%20Currencies/Bitcoin/bitcoin_5_XtraSmall.jpg)
Bitcoin (BTC) price appears poised for a decline this week, influenced by slight outflows in US spot ETFs, selling activity among BTC miners, and a combined transfer of 4,690.28 BTC to centralized exchanges by the US and German governments.