Top 3 Losers: LINK, OMG, and YFI drop over 5% signaling further correction on the horizon
- LINK has recently topped out at $11.81 and has started a correction period.
- OMG is down 7% in the past 24 hours and could be looking at more bearish action.
- YFI continues with its downtrend and fails to recover.

Although the entire cryptocurrency market suffered a slight correction in the past 48 hours, some coins have suffered more significant losses. The total market capitalization dropped from $370 billion to $361 billion due to the increased strength of the U.S. dollar, which is inversely correlated with the crypto market.
LINK trading between two crucial levels
Chainlink is currently trading at $11, right between two critical levels on the daily chart. The 50-SMA at $11.4 is acting as a healthy resistance level, and the 50-SMA at $11 is acting as a strong support level. However, the digital asset is down 8% in the past 48 hours and has more bearish momentum in the short-term.
LINK/USD daily chart

The TD sequential indicator has presented a '7' green signal, which is usually indicative that a sell signal is coming soon. A breakout below the 50-SMA at $11 would push LINK down to $10.5 and then towards $8.4 if it breaks as there are no other support levels on the way down.
LINK IOMAP Chart
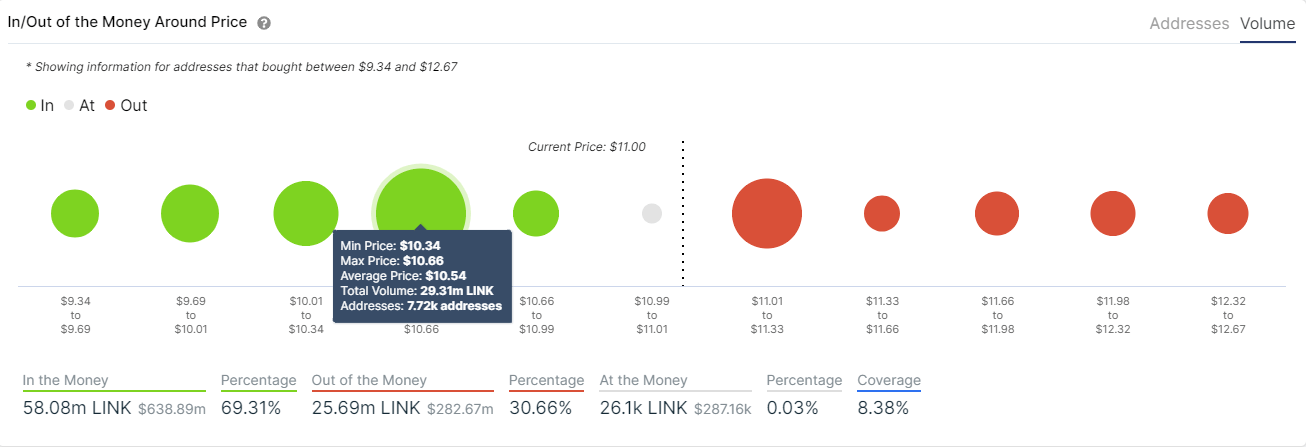
The In/Out of the Money Around Price chart by IntoTheBlock confirms this theory and shows a strong support area between $10.34 and $10.66, where close to 30 million LINK were purchased. The support below or above this point is far lower.
LINK/USD 4-hour chart
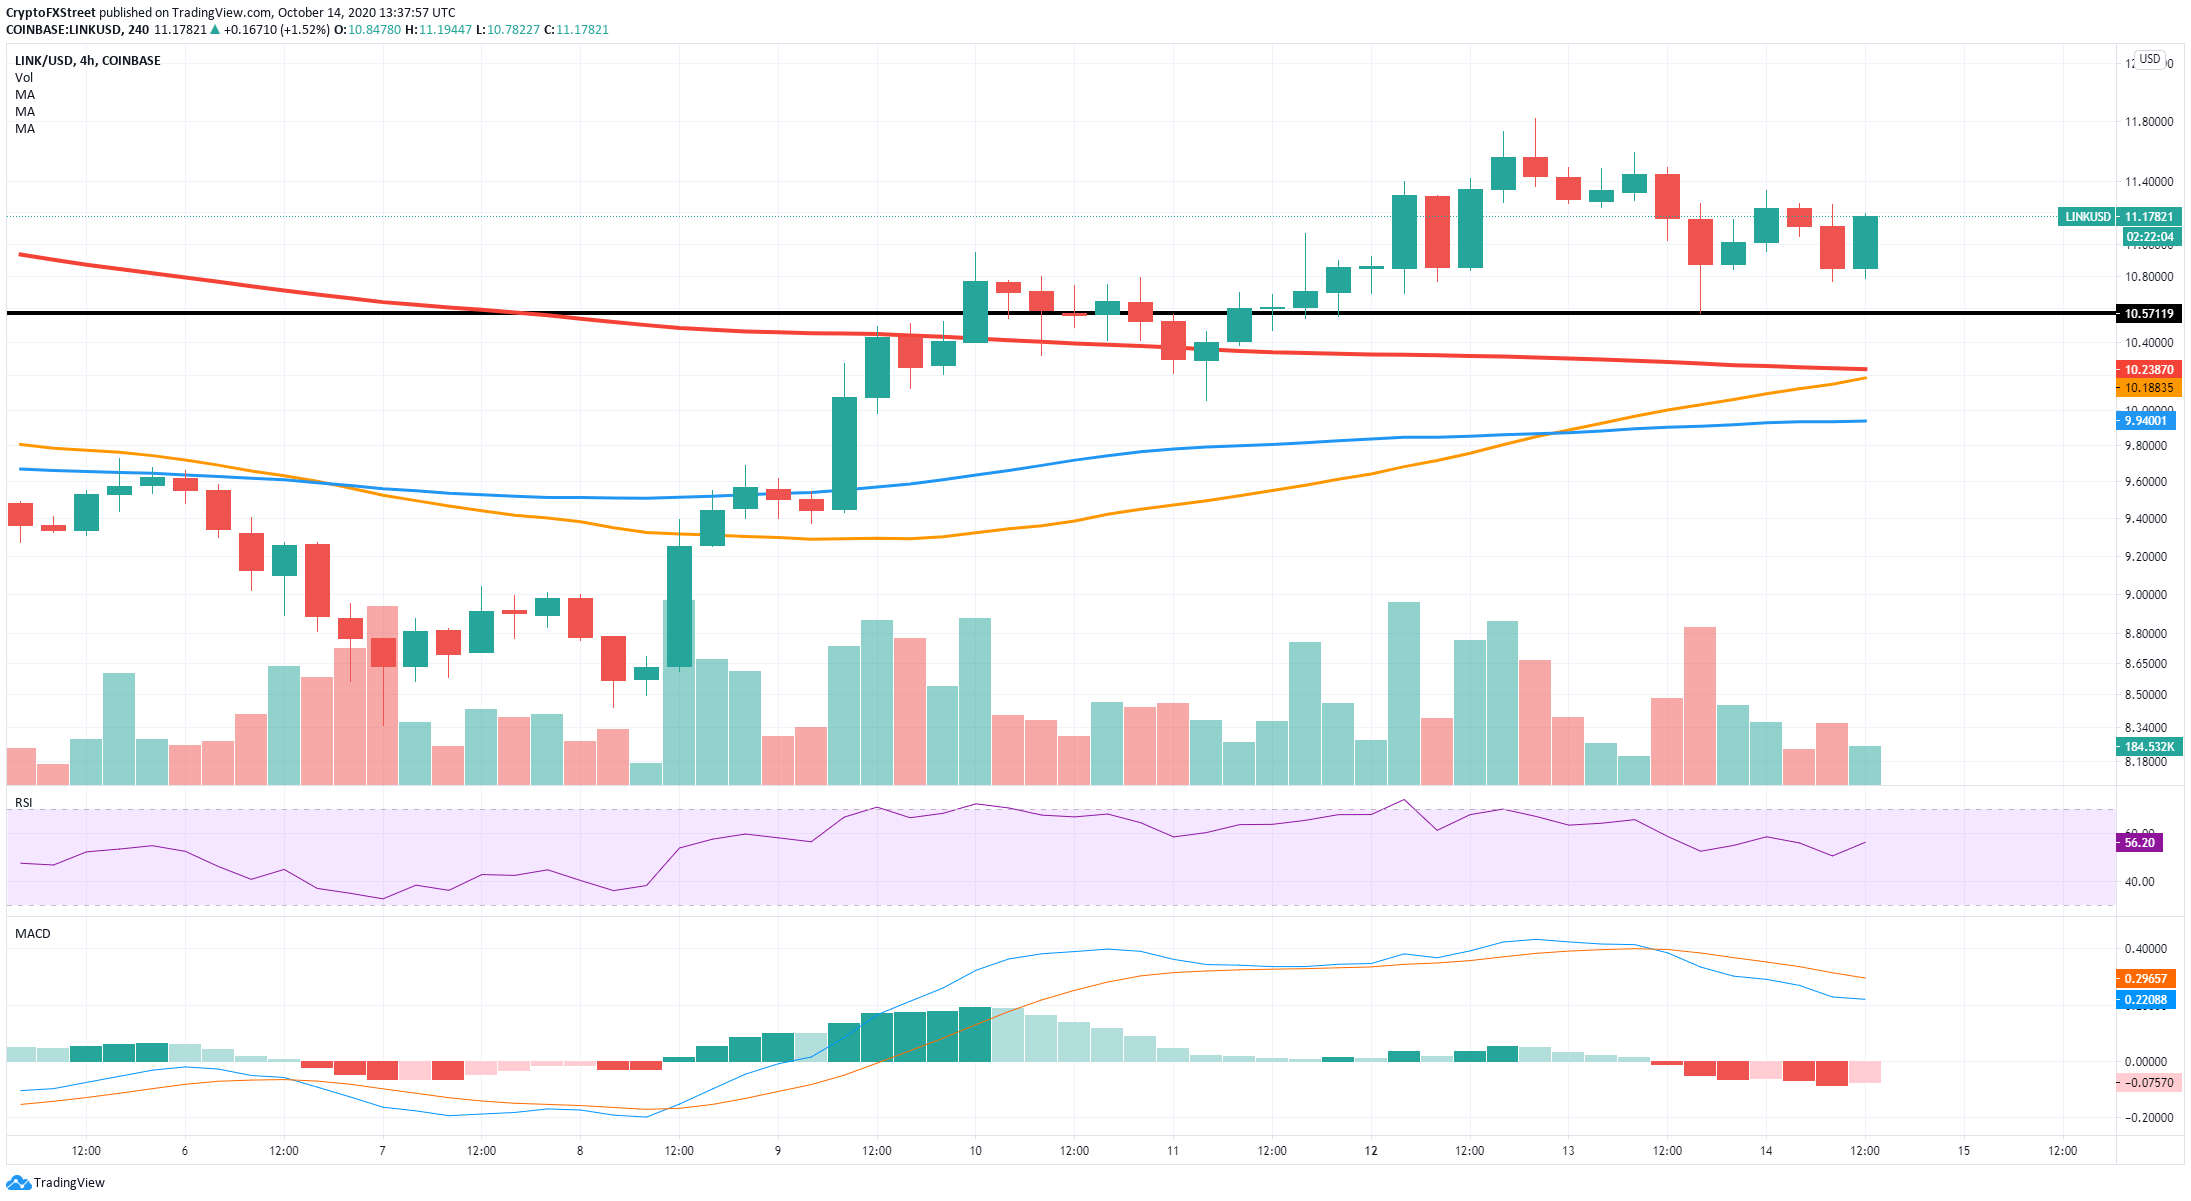
Despite the increased selling pressure, LINK's price is still far above any of the three SMAs on the 4-hour chart. Additionally, although the digital asset established a lower high, it seems to have created a higher low at $10.76 compared to $11.25.
Furthermore, looking at the same IOMAP chart, resistance towards $12 is far lower than support at $11 and below. The primary resistance area is located between $11 and $11.33, with a volume of 14.78 million LINK. A bullish breakout above this point can push Chainlink towards $12 again.
OMG turns bearish in the short-term
After a great rally towards $4.44 from a low of $2.48, OMG managed to establish a higher low at $3.02 but has failed to create a higher high. Instead, it seems that the digital asset is forming an equilibrium pattern on the daily chart with lower highs and higher lows.
OMG/USD daily chart
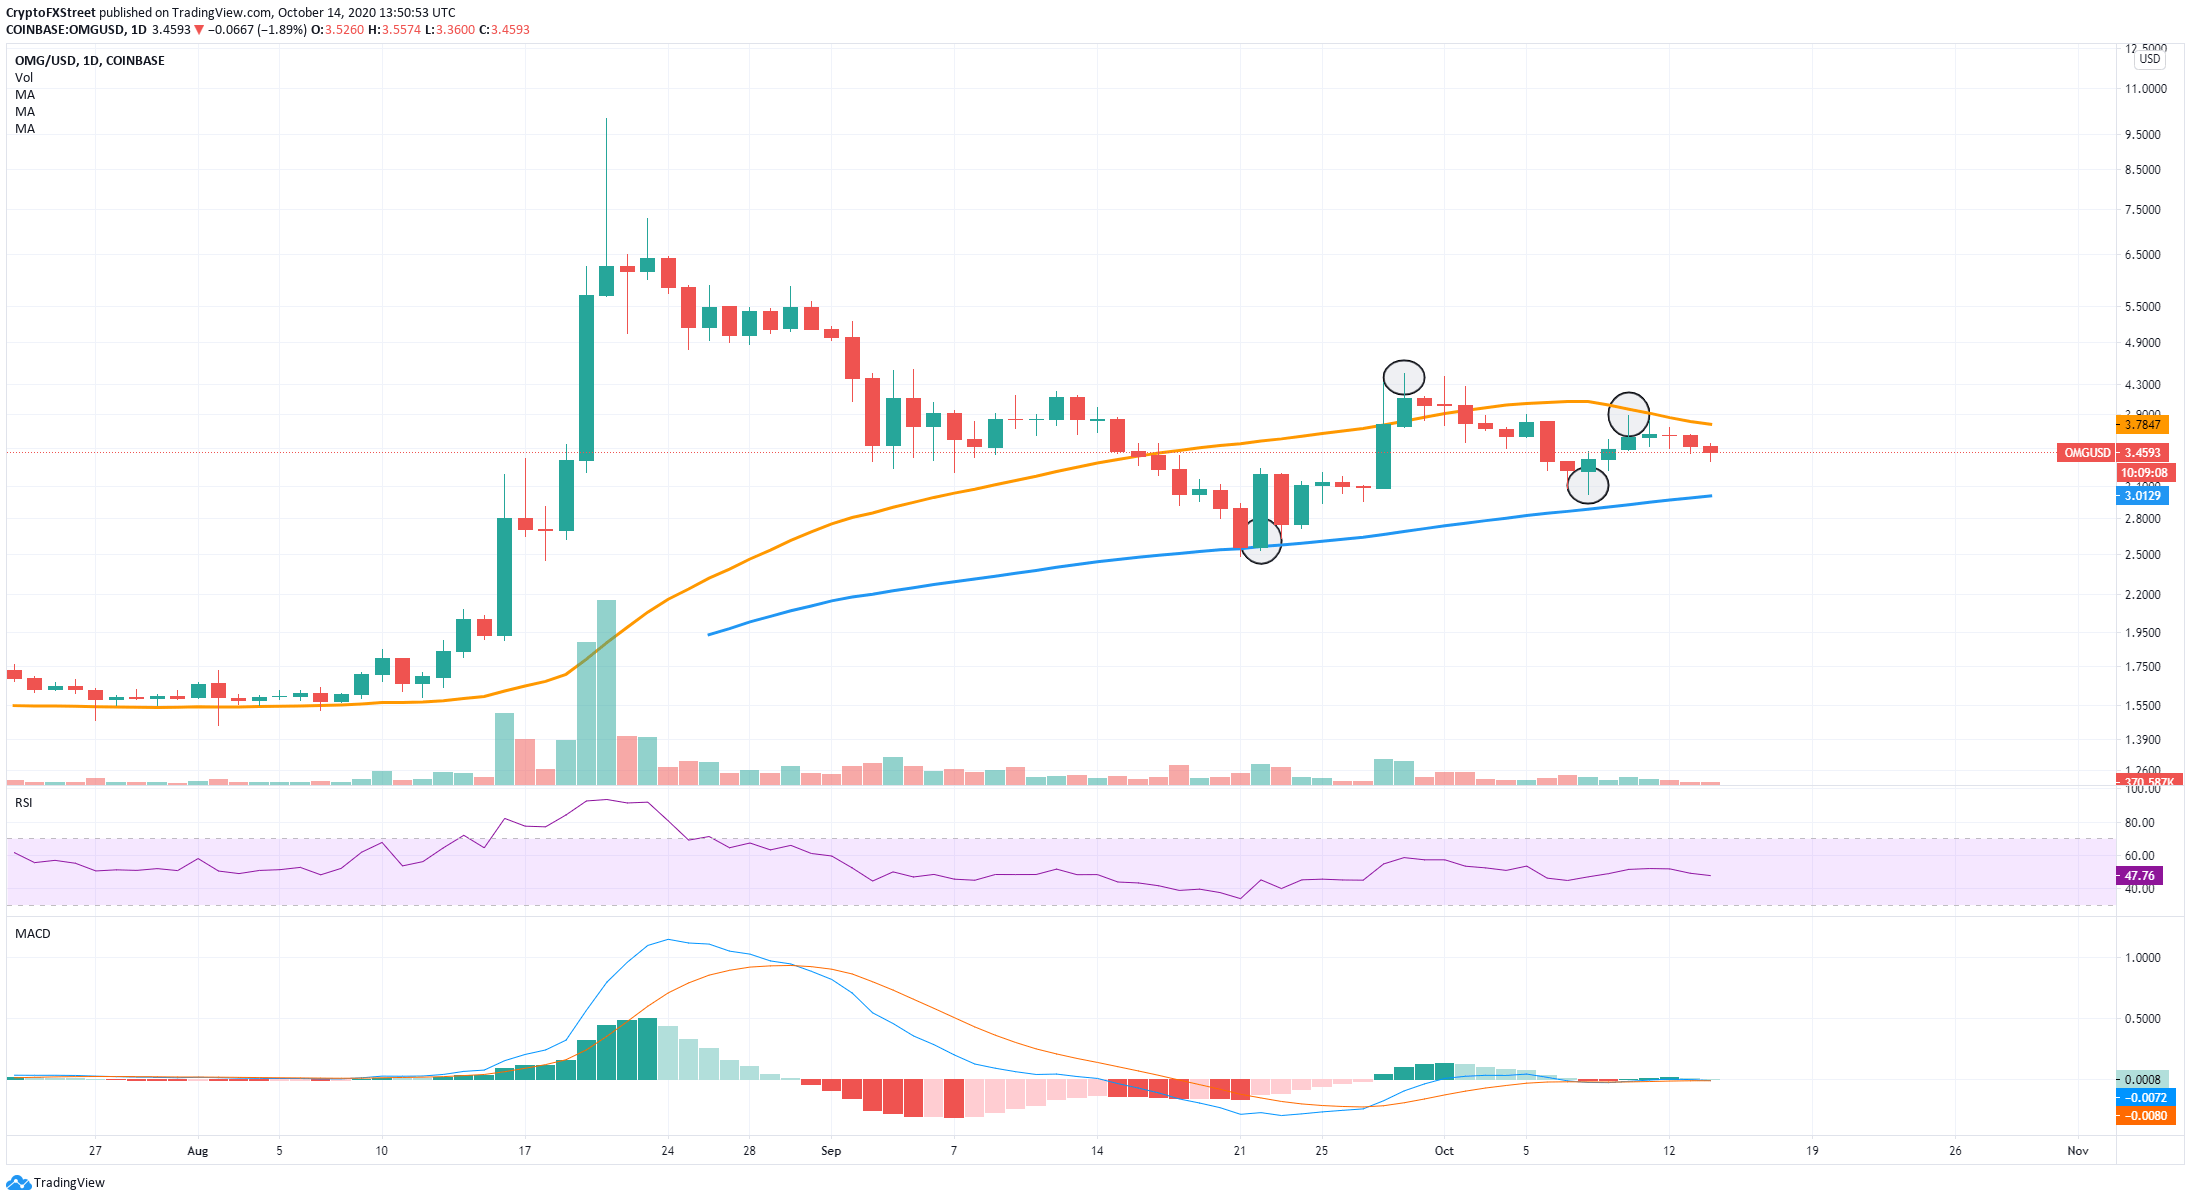
An equilibrium pattern doesn't necessarily favor anyone; however, the momentum of OMG is shifting in favor of the bears as the MACD is on the verge of a bearish cross for the first time since August 31, which had a significant impact on the price of the digital asset pushing it down 50% within the next few weeks.
OMG IOMAP Chart
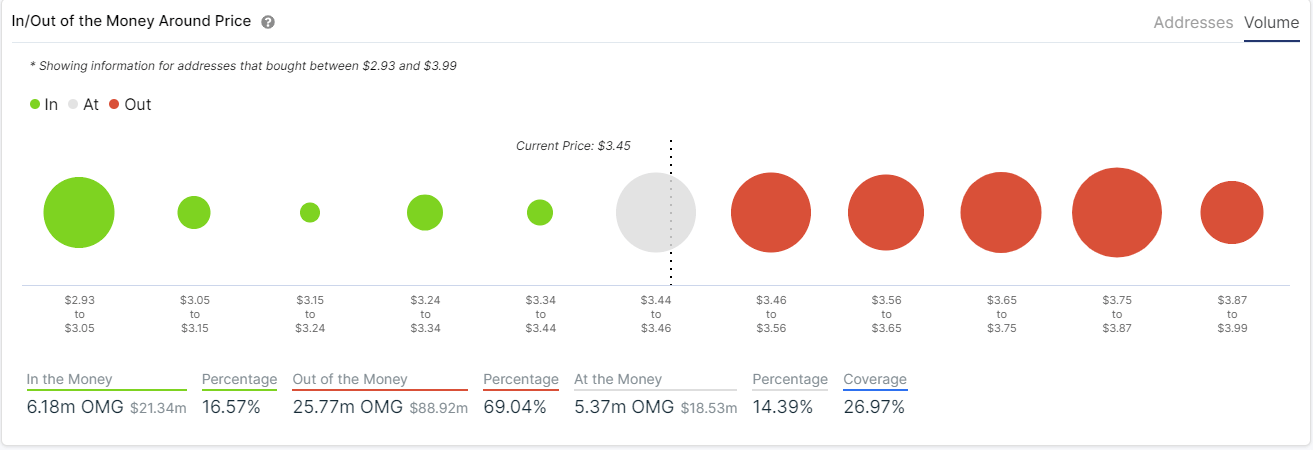
If bearish momentum continues, the next target price would be $3, which coincides with the last higher low established and the 100-SMA on the daily chart. The IOMAP chart confirms this theory, showing really small support areas above $3 when compared to the resistance to the upside.
OMG/USD 12-hour chart
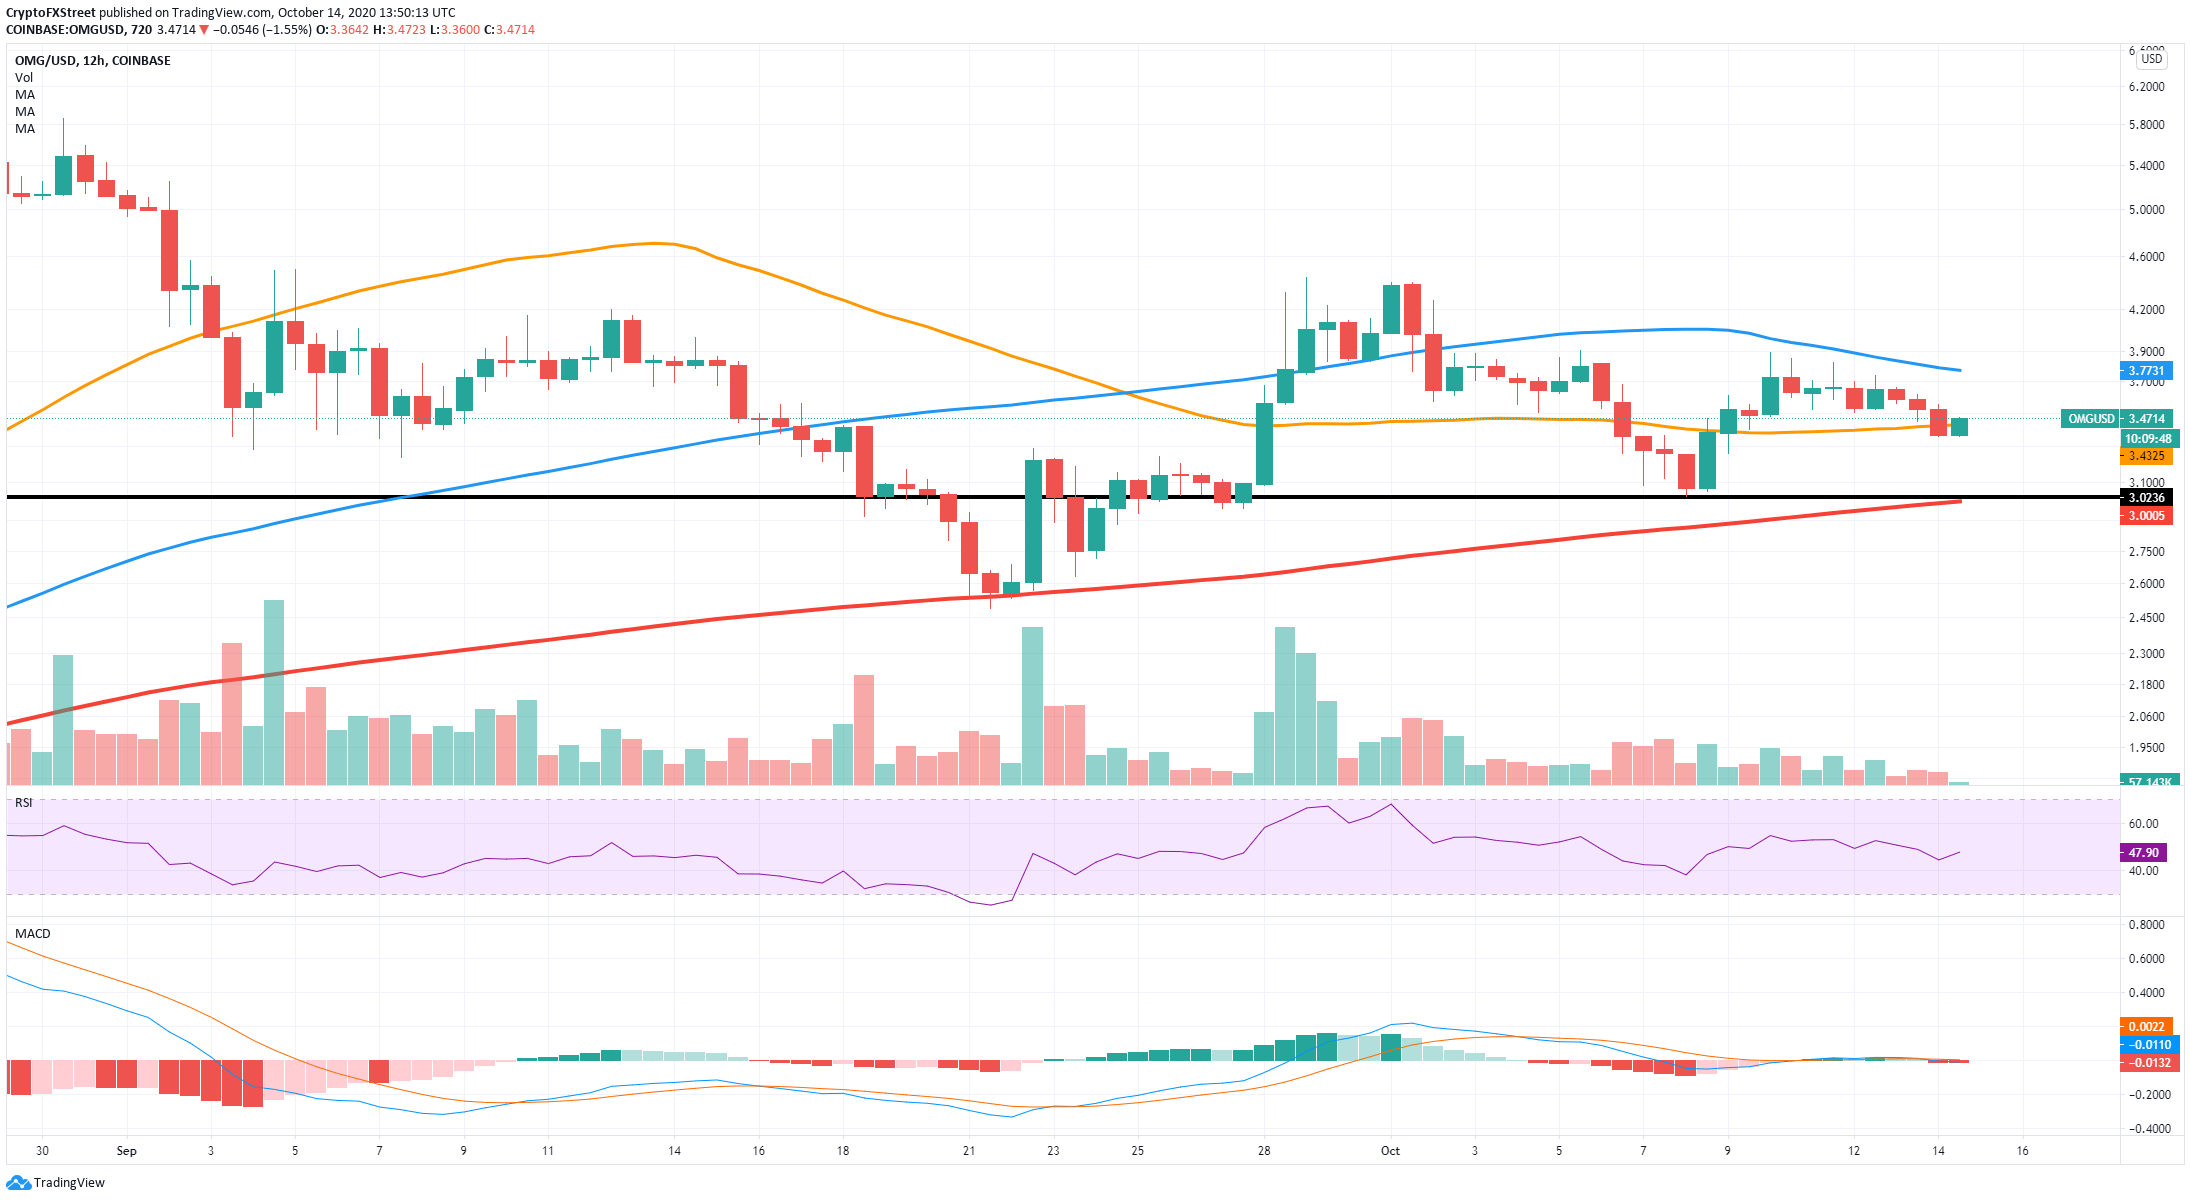
On the 12-hour chart, OMG's price briefly slipped below the 50-SMA but managed to recover and defend the support level. Bullish continuation above this point can push the digital asset up to the 100-SMA at $3.77 in the short-term.
OMG Holders Distribution Chart
 [15.48.29, 14 Oct, 2020]-637382820374141122.png)
Additionally, it seems that the number of OMG whales is increasing. The number of Investors holding between 100,000 and 1,000,000 coins rose from 72 on October 6 to 77 currently, indicating that interest in the digital asset is higher.
YFI seems unable to recover
YFI is down by 16% in the past two days after getting rejected from a critical resistance level on the way up. Several indicators are showing that digital asset might be poised for further correction in the short-term.
YFI/USD 4-hour chart
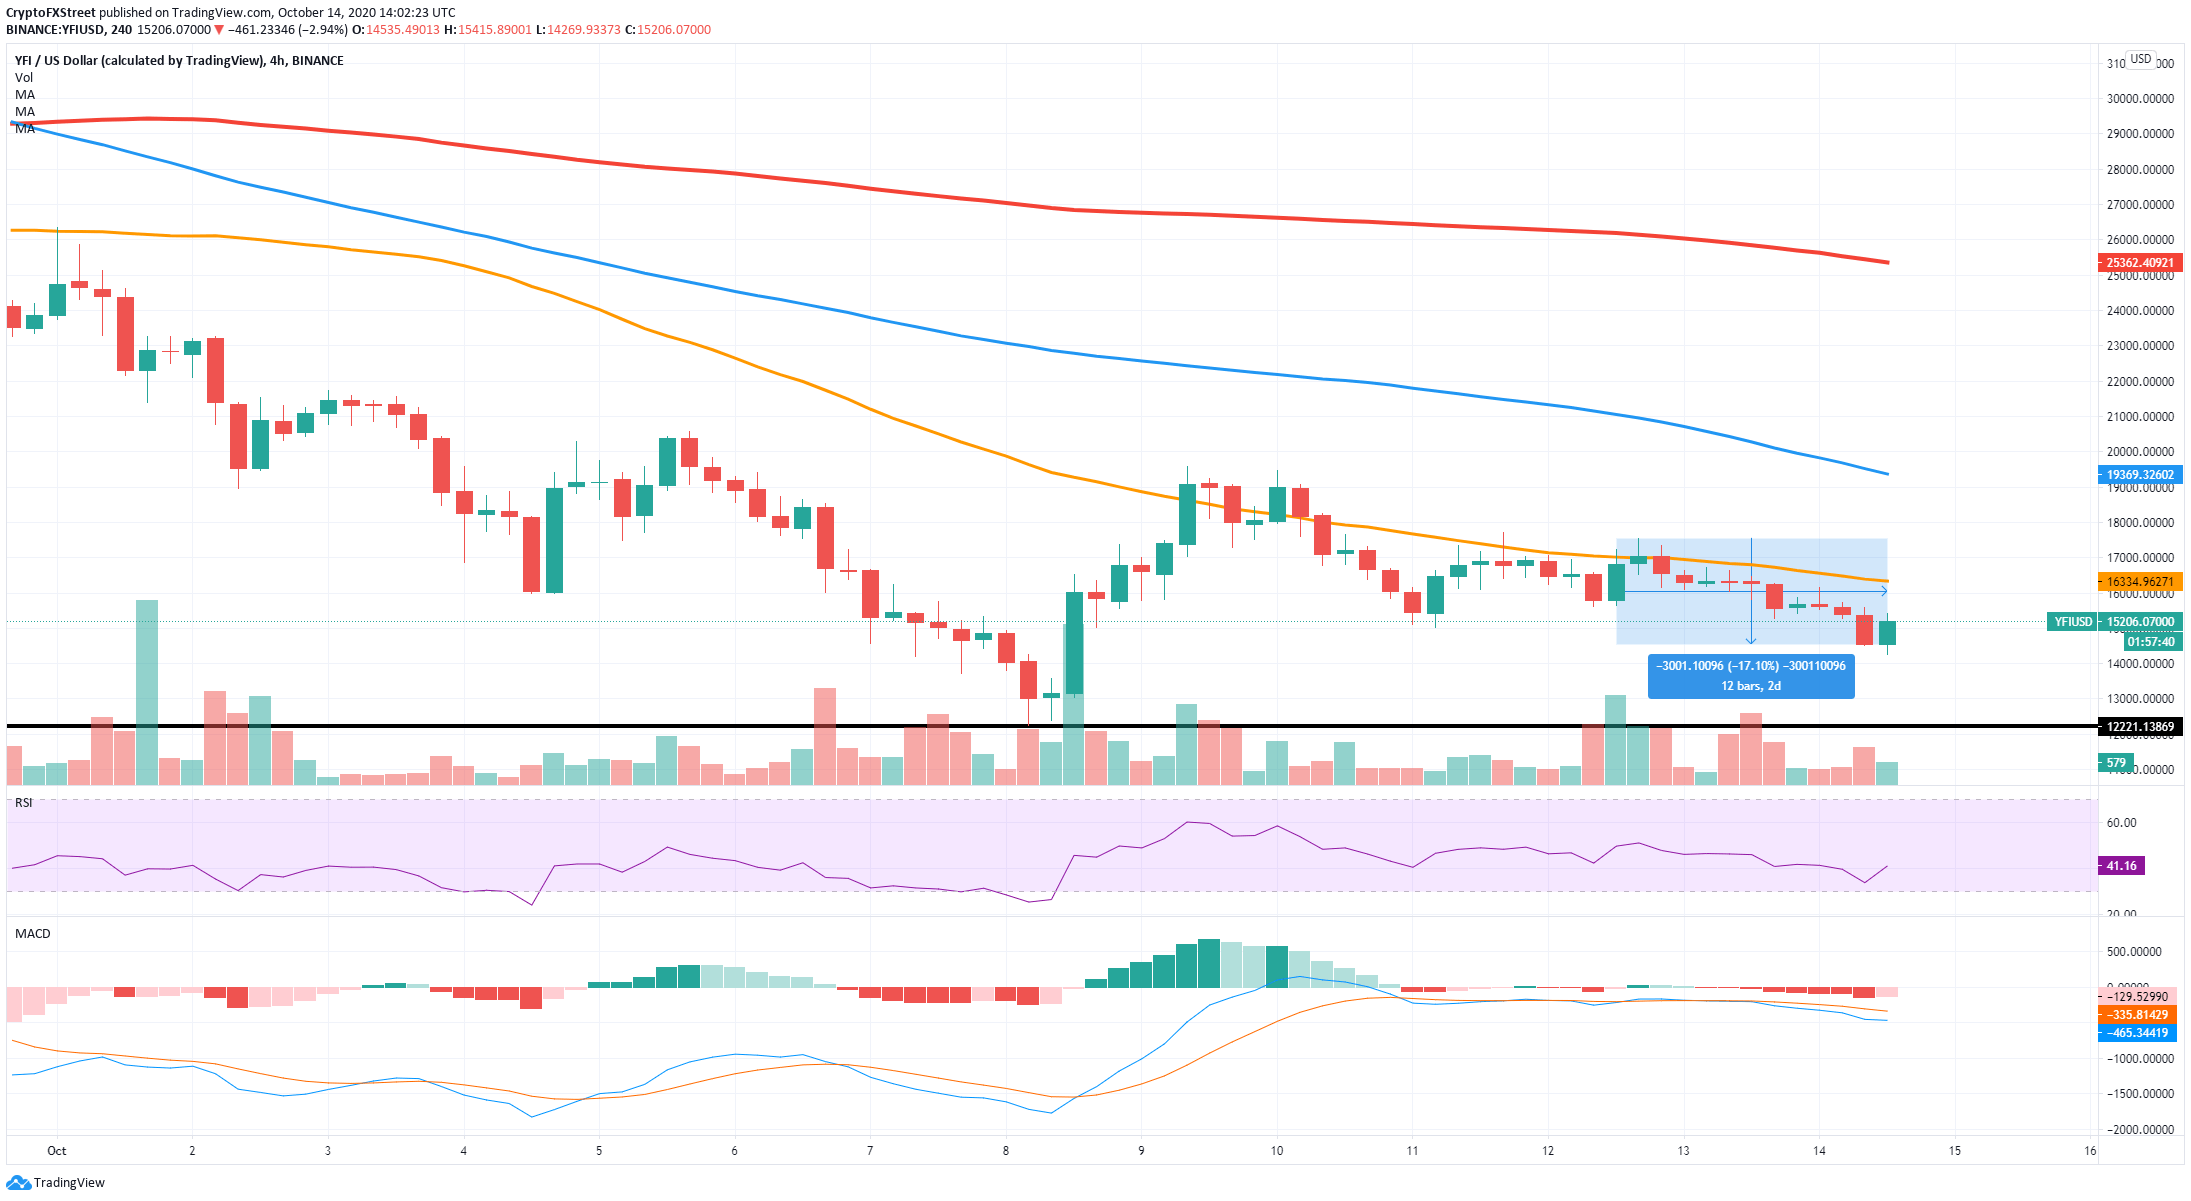
The 50-SMA, currently at $16,335, has been acting as a robust resistance level, rejecting the price of YFi several times from October 9 until now. The MACD turned bearish on October 13 and continues growing in strength, showing no real signs of a recovery.
YFI New Addresses
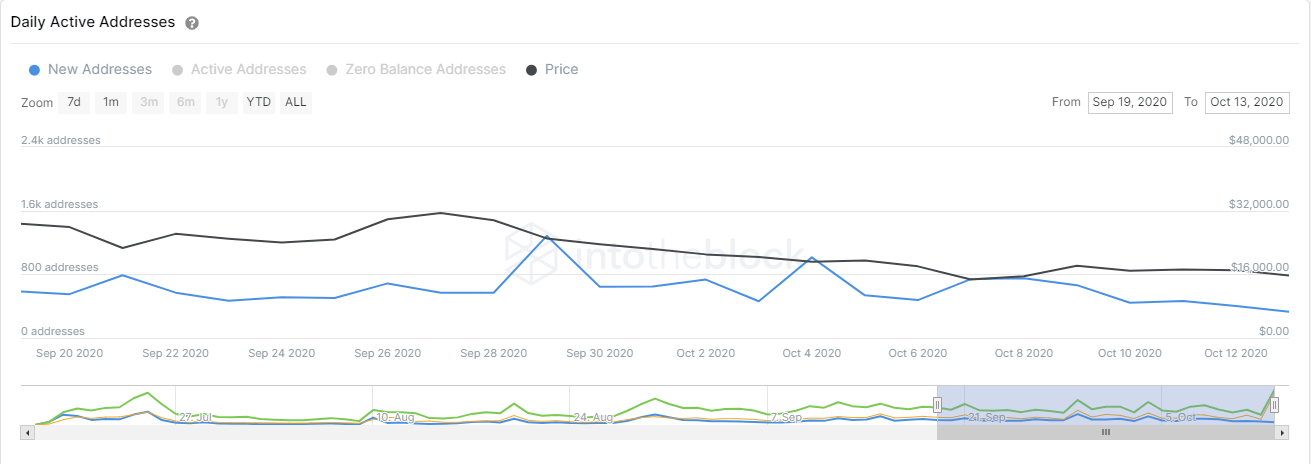
Another concerning trend for YFI bulls is the decrease in the number of new addresses joining the network. In the past seven days, the percentage is -30%. This drop, combined with the current short-term downtrend, could push YFI down to $12,000.
YFI/USD 10-minutes chart

On the other hand, it seems that YFI bulls are coming back on the shorter time-frames like the hourly chart. The price climbed above the 50-SMA, turning into support, and it's eying up the 100-SMA at $15,439. The MACD turned bullish and rose significantly during the past hour.
YFI Active Addresses Ratio
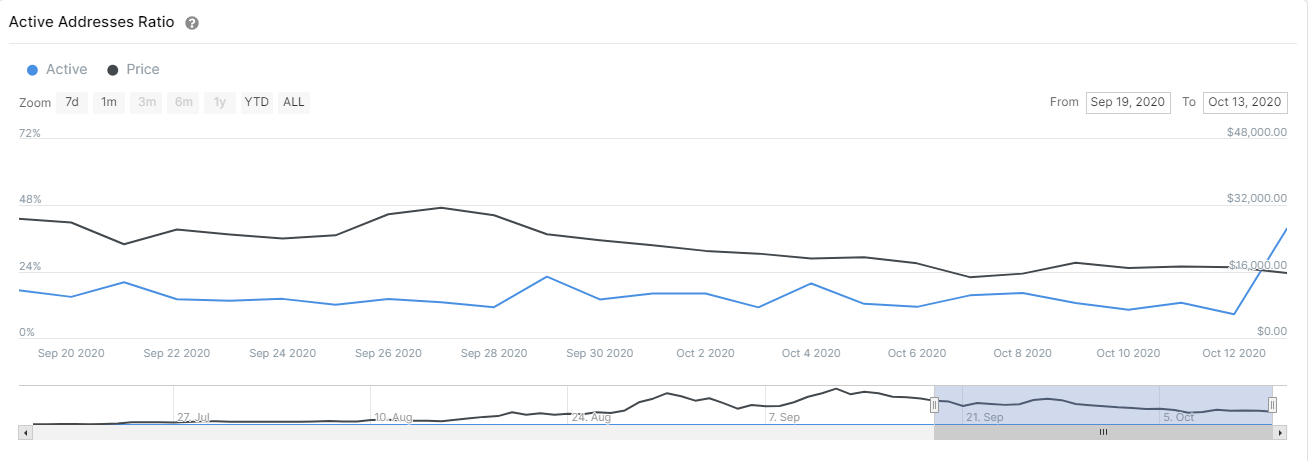
We can observe a huge spike in the number of active addresses for YFI, from 8.6% to 39% currently. This ratio represents addresses with a balance that had a transaction during a given period and shows an increase in the interest of YFI. The next two target prices are $15,435 and $15,782.
Critical levels for LINK, OMG and YFI
The breakout of 50-SMA at $11 would push LINK down to $10.5 and then towards $8.4. For OMG, the bearish target price Is $3 right at the 100-SMA on the daily chart if the bearish momentum continues. YFI, on the other hand, is showing signs of potentially correcting further down to $12,000.
When it comes to the bullish outlook, LINK is looking for a bullish breakout above $11.3, which can push it towards $12 again.OMG wants continuation from the 50-SMA on the 12-hour chart to reach $3.77. YFi, on the other hand, has two target prices on the horizon at $15,435 and $15,782.
Author

Lorenzo Stroe
Independent Analyst
Lorenzo is an experienced Technical Analyst and Content Writer who has been working in the cryptocurrency industry since 2012. He also has a passion for trading.


