Top 3 Gainers: LINK, YFI, and SXP skyrocket over 15%, aiming for further gains
- LINK and YFI are well poised for further gains following a massively bullish Thursday.
- SXP faces three strong resistance level up top, which may force a retreat.
-637336005550289133_XtraLarge.jpg)
With Bitcoin making significant gains, the rest of the cryptocurrency market followed suit in a largely profitable Thursday. Among these, Chainlink (LINK), Yearn.Finance (YFI) and Swipe (SXP) made the most impressive gains.
Chainlink
Jumping up by 15% from an intraday low of $8.45 to a high of $9.70, LINK had an impressive showing this Thursday. Currently, the 50-12-hour SMA is acting as immediate market resistance, which is pushing the price down.
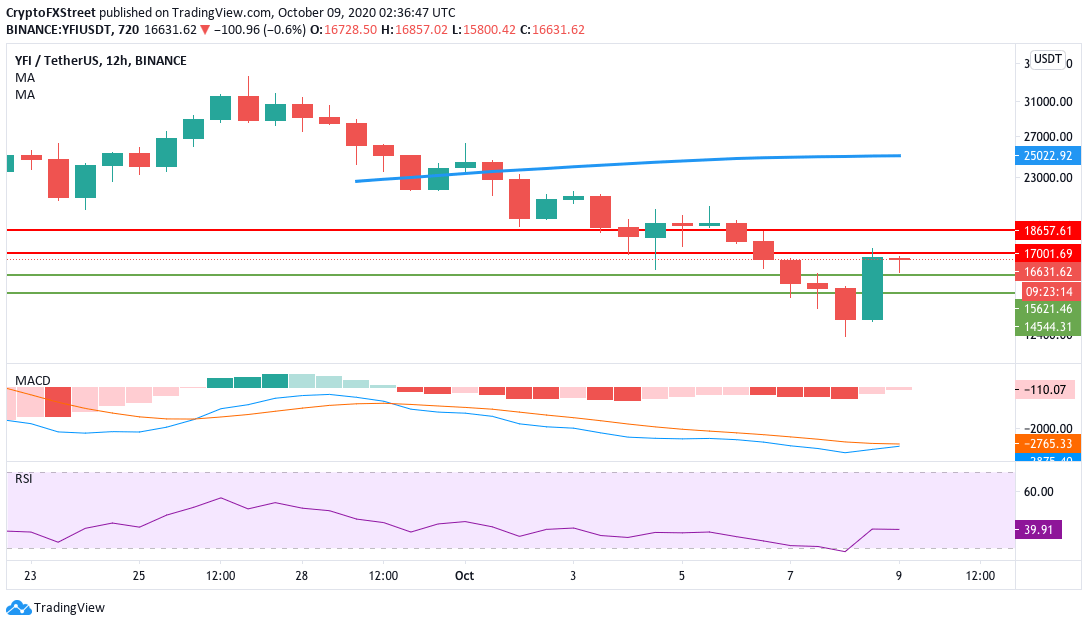
LINK/USD 12-hour chart
-637378122051325289.png)
However, the MACD shows increasing bullish momentum, which should give the buyers enough firepower to breach above this curve. Up next, we have the most significant resistance at the 200-12-hour SMA ($10.65), as defined by the IOMAP.
LINK IOMAP
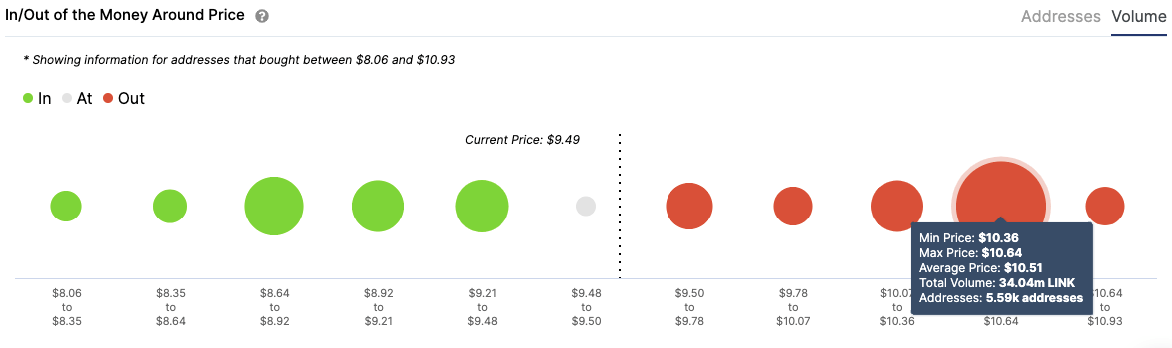
As per IntoTheBlock’s “In/Out of the Money Around Price” (IOMAP), the $10.65 resistance is quite easily the most significant obstacle that the bulls face on their way up. In this level, 5,600 addresses had previously bought 34 million LINK tokens. Upon conquering this level, the bulls should be able to push the price up to the 100-12-hour SMA ($11.75).
LINK holders distribution
 [07.59.33, 09 Oct, 2020]-637378122758850365.png)
Santiment’s holders distribution graph further verifies the bullish hypothesis. Since October 3, the number of holders with at least one million LINK tokens went up by 3. This shows that the whales are consolidating their positions instead of selling off their LINK.
While all this looks good, do keep in mind that the IOMAP shows that the nearest healthy support level is at $8.75. So, if the bears do take control, they will be able to take the price down to $8.75 before they meet an obstacle.
Yearn.Finance
YFI.Finance jumped by 40% from an intraday low of $12,275 to a high of $17,345. This was the first green candlestick that YFI had in its 12-hour chart following five consecutive bearish sessions.
YFI/USDT 12-hour chart
Currently, the price is getting rejected at the $17,000 resistance line, which is a strong level, as noted by the IOMAP. The MACD shows that the market momentum is about to reverse from bearish to bullish.
YFI IOMAP
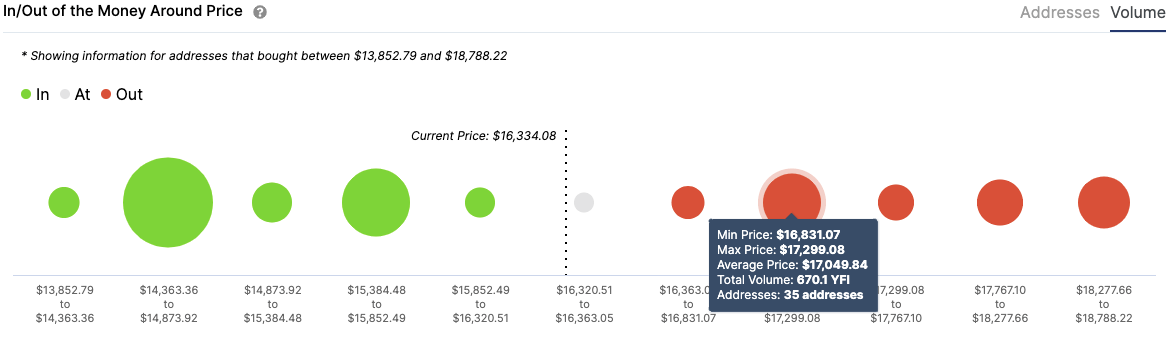
Previously, 35 addresses had purchased 670 YFI tokens around the $!7,000 price level. Upon conquering this level, the LINK bulls will find the next strongest resistance at $18,650. If they manage to break past these levels, the price should be able to reach the 20-12-hour SMA curve at $25,000.
However, if the bears take control, it should be noted that the nearest healthy support lies at $15,500. If this level isn’t enough to absorb all the selling pressure, the next healthy level is at $14,500.
Swipe
Finally, we have Swipe. As per the 12-hour chart, SXP/USDT jumped by 20% from an intraday low of $1.115 to a high of $1.35.
SXP/USD 12-hour chart

After bouncing up from the $1.155 support line, the price has jumped up and is currently facing rejection at the $1.33 resistance line. Further upside is presently severely limited by strong resistance levels. To explore further, let’s check out the IOMAP.
SXP IOMAP
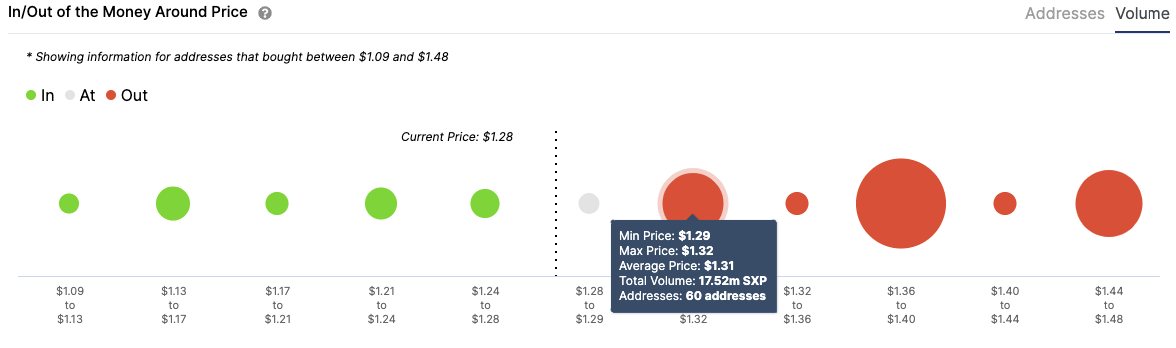
According to the IOMAP, there are three strong resistance levels at $1.31, $1.38 and $1.46. Previously, 60 addresses had purchased an astounding 17.5 million SXP tokens around the $1.31 level. If this level doesn’t absorb all the buying pressure, the next two levels should be more than enough to take care of the residual pressure.
On the downside, there is a lack of strong support levels. Any price correction could lead the price to drop below the $1.10. However, it’s not all doom and gloom for the bulls. To know what we mean by this, let’s check out the holders distribution graph again.
SXP holders distribution
 [09.00.28, 09 Oct, 2020]-637378125435069215.png)
According to Santiment’s holders distribution graph, the number of holders in the 1 million to 10 million bracket went down from 5 to 3, before going back up to 5 again. The number of holders with at least 10 million tokens went up from 6 to 9 in this time period. This shows that the whales aren’t selling off their tokens, which is a positive sign for the network.
Author

Rajarshi Mitra
Independent Analyst
Rajarshi entered the blockchain space in 2016. He is a blockchain researcher who has worked for Blockgeeks and has done research work for several ICOs. He gets regularly invited to give talks on the blockchain technology and cryptocurrencies.


