Top 3 Gainers: BCH, BTT, and WAVES jump over 5% leading the crypto market recovery
- BTT is up 8% in the past 10 hours after a significant price spike.
- BCH has been slowly climbing up, outperforming many cryptocurrencies in the past few weeks.
- WAVES saw a massive 13% price explosion in the past six hours.

The entire cryptocurrency market had a great week gaining close to $30 billion in market capitalization. Bitcoin and other major coins suffered a slight pullback; however, not all coins had a correction, here are the three top gainers of the past 24 hours.
BitTorrent planning to continue with its uptrend
BTT managed to establish a daily uptrend after setting several higher lows and higher highs. The digital asset gained around $40 million in market capitalization in the past week, and it’s now aiming to hit the last daily high at $0.0003 with the help of the uptrend.
BTT/USDT daily chart

On the daily chart, the bulls have managed to defend a critical support level at $0.00033 in the form of the 200-SMA. The price is currently above the 50-SMA, which bulls are looking to turn into a support level after the close of today’s candlestick.
The MACD has remained bullish since September 26, and trading volume has increased a lot since the beginning of September. The next potential price target for bulls would be $0.00038, where the 100-SMA is currently located. The RSI is not overextended and will not stop the price for now.
BTT/USDT 1-hour chart

On the other hand, the 1-hour chart is showing bearish signs. The TD sequential indicator has just presented a sell signal. The trading volume is declining despite the past surge, usually an indication that bulls are weak. The last sell signal had a lot of follow-throughs, dropping the price of BTT by 5% within the next 15 hours.
There are several essential price levels for the bears. The nearest support level on the hourly chart is the 100-SMA, located at $0.00034. The 50-SMA and the 200-SMA coincide at $0.00034, which would be the next target price.
Will BCH steady uptrend stop?
BCH has been trading inside a 4-hour uptrend at a slow but steady pace. The price has established several higher lows at $233, $237, $250, and $257 currently and many higher highs. The uptrend is robust, and bulls are looking for more.
BCH/USD 4-hour chart

The MACD turned bullish on October 13, and it’s not showing signs of weakness just yet. Although it has been extended for some time, the RSI didn’t stop the bulls from pushing BCH higher. The next target price is located at $266, a high established on September 3.
BCH IOMAP Chart

The IOMAP chart actually shows that the strongest resistance area is located between $296 and $306, with close to 1 million BCH in volume. This means that a breakout above $266 can easily push BCH towards $298 and $306 in the longer-term.
BCH/USD daily chart
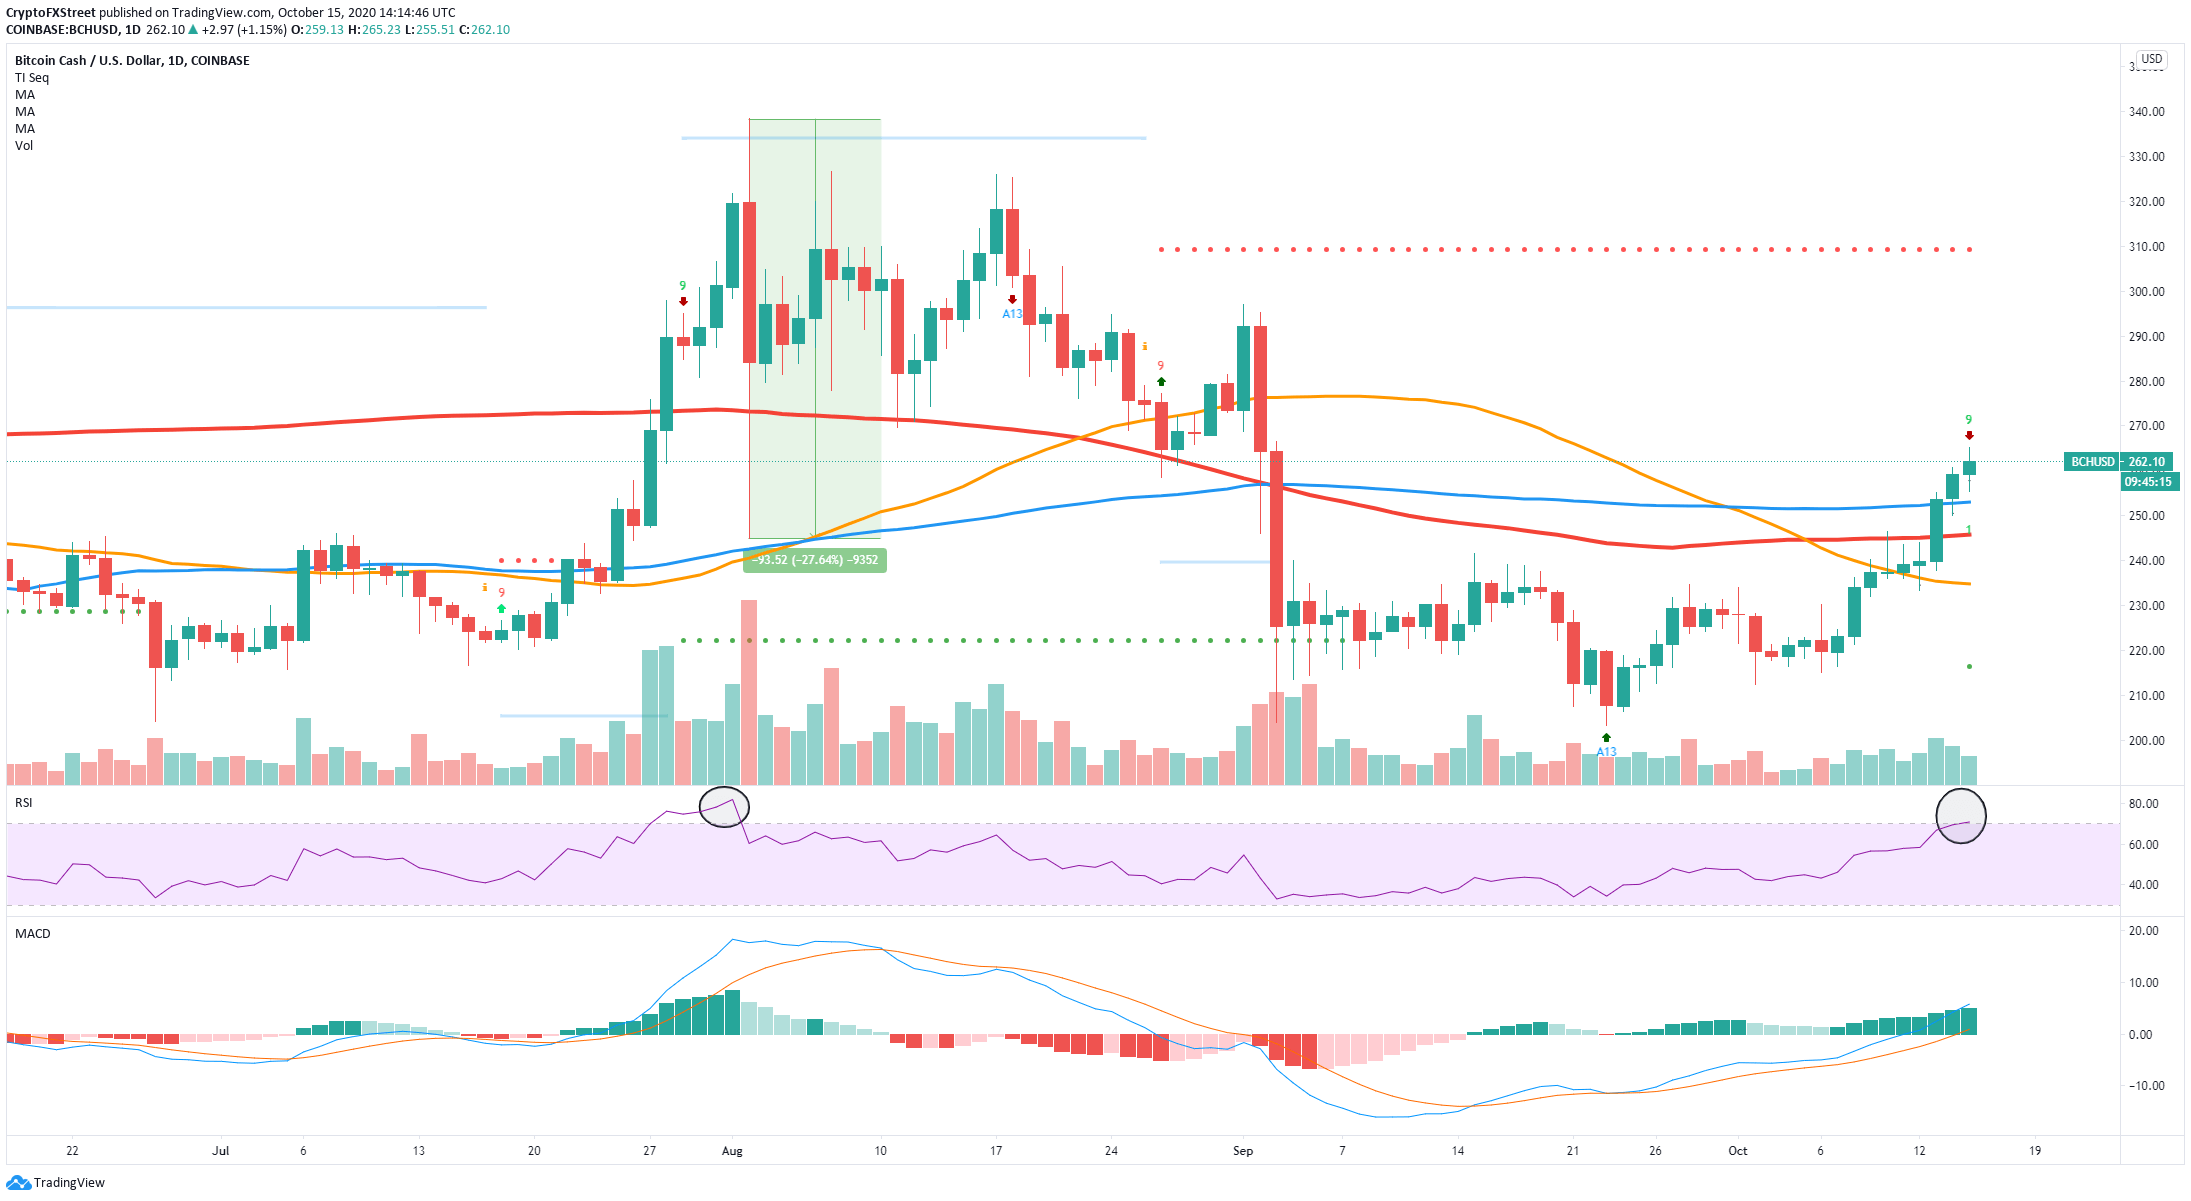
On the daily chart, the TD sequential indicator has presented a sell signal, and the RSI is overextended for the first time since July 2020. The last time the RSI was overbought, the price of BCH eventually had a major 27% crash.
BCH Bulls and Bears Chart

Selling pressure seems to be increasing for BCH as the ‘Bulls and Bears’ chart shows the bears are in control with a volume of 1.43 million coins in the past seven days as opposed to only 1.34 million for the bulls. At the very least, the digital asset could fall towards $253, where the 100-SMA is currently located on the daily chart.
WAVES waiting for a decisive breakout
WAVES had a major price spike in the past 24 hours, climbing from a low of $2.43 to a high of $2.7. In the past week, the digital asset has gained around $40 million in market capitalization, positioning itself as the 56th largest cryptocurrency in the market.
WAVES/USDT daily chart

WAVES is trading inside a tight range on the daily chart that only had a crack on September 13. The most significant resistance level is $2.62, a level that has been tested several times in the past month. It also basically coincides with the 100-SMA on the daily chart.
A breakout above both levels would most likely push WAVES up to $3.14, which is the high of September 13 during the first breakout. The MACD turned bullish on October 8, and it’s gaining a lot of strength; meanwhile, the RSI is not overextended yet.
WAVES/USDT 1-hour chart
-637383691264056448.png&w=1536&q=95)
It’s important to note that WAVES already attempted to breakout above the crucial $2.62 resistance level and got rejected again. The rejection hasn’t been too strong, but it’s still a bearish sign in the short-term. The RSI is close to overextension on the hourly chart, which makes it difficult for the bulls to see a definitive breakout above $2.62.
Another rejection from the resistance level could push WAVES down to $2.5, where both the 100-SMA and the 50-SMA are located. The huge spike in trading volume on the breakout had no continuation, another bearish sign. The lowest target price for bears would be $2.4, the 200-SMA.
Critical price points for BTT, BCH, and WAVES
BTT bulls are looking at the next potential price target at $0.00038, where the 100-SMA is currently located on the daily chart. A bullish breakout for BCH above $266 can quickly push BCH towards $298 and $306 in the longer-term. WAVES bulls need to pay close attention to $2.62. A breakout can drive the price towards $3.14.
On the bearish side, BTT looks at $0.00034, 100-SMA, located on the hourly chart. For BCH, at the very least, it could fall towards $253, where the 100-SMA is currently located on the daily chart. The lowest target price for WAVES bears would be $2.4, the 200-SMA.
Author

Lorenzo Stroe
Independent Analyst
Lorenzo is an experienced Technical Analyst and Content Writer who has been working in the cryptocurrency industry since 2012. He also has a passion for trading.


