- Polkadot, Kusama and Cardano lead the crypto ecosystem in terms of development activity based on a recent report.
- Analysts believe that a large volume of GitHub commits in DOT and ADA signal utility, relevance and long-term potential.
- Polkadot witnessed the largest increase in its total value locked on Thursday, and experts have predicted a rally in ADA price.
Polkadot, Kusama and Cardano are the top cryptocurrencies in the crypto ecosystem in terms of development activity. There is a consistent spike in the volume of commits on GitHub, analysts consider this a sign of bullish potential in the assets.
Top cryptocurrencies with massive development activity
Analysts at Crypto intelligence tracker Santiment identified top assets with the highest development activity, calculated by the developers’ GitHub commits. Experts noted the consistent rise in development activity signals long-term potential in an asset.
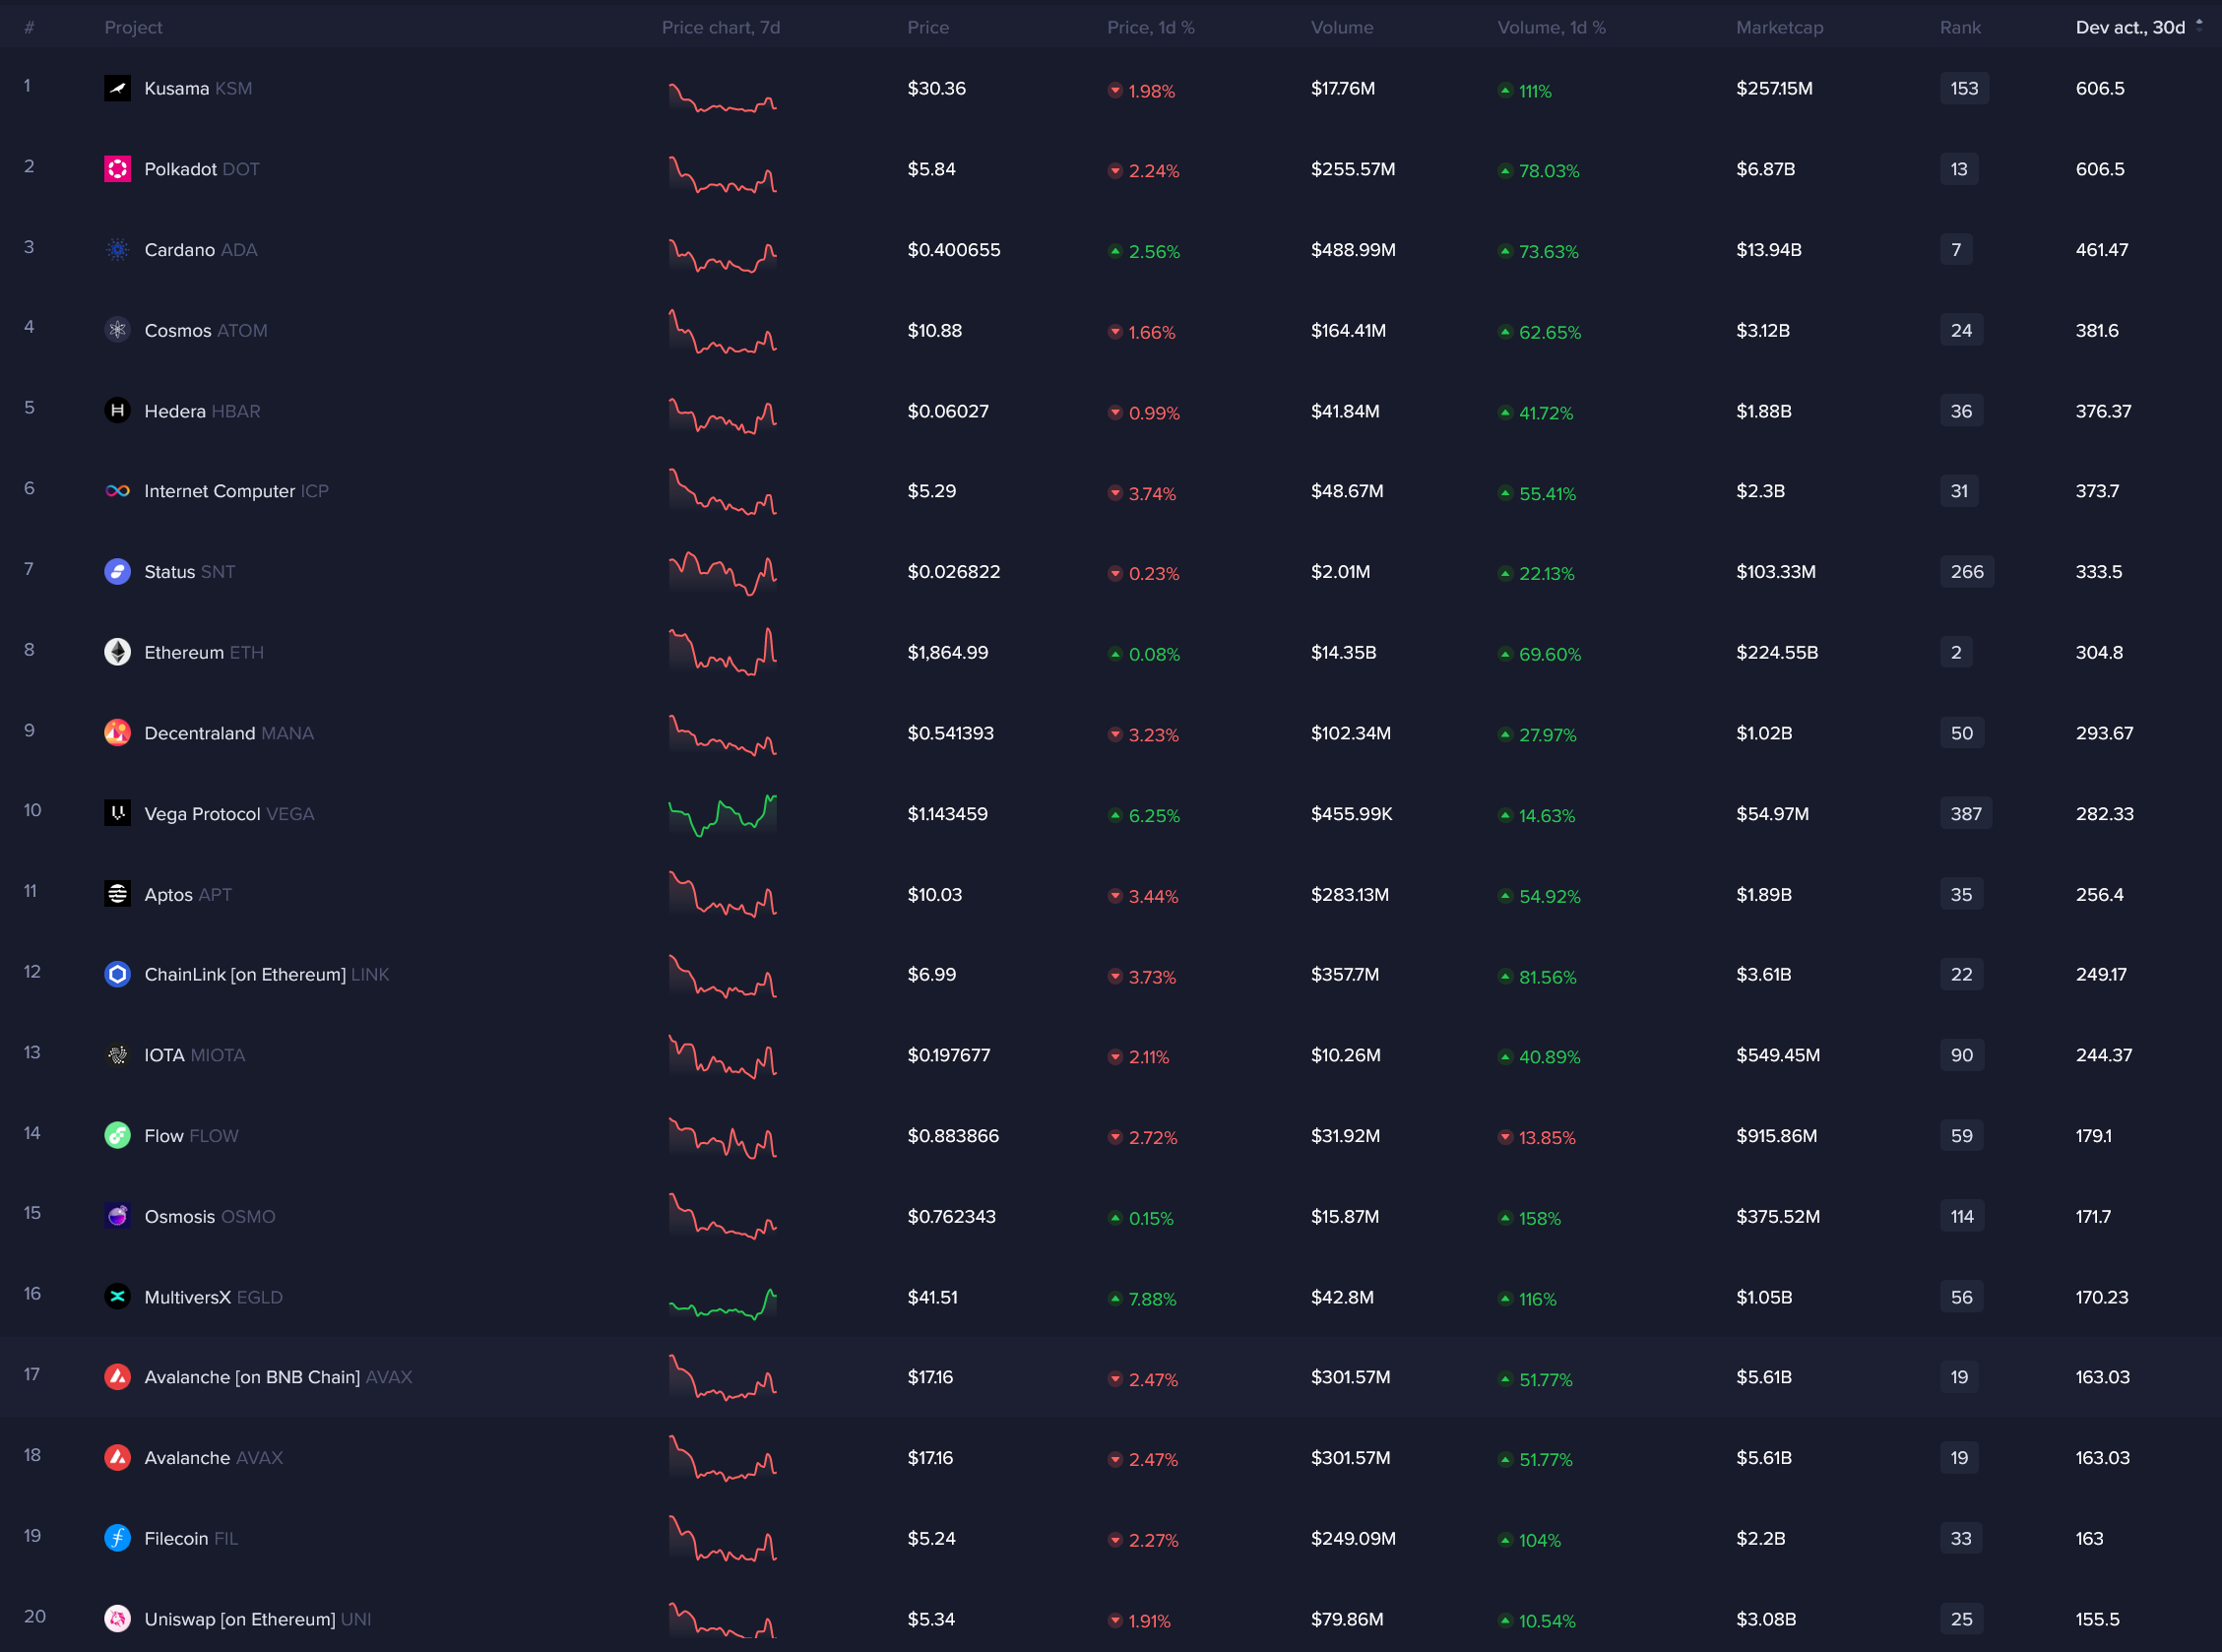
Development activity across crypto tokens
As seen in the chart above, Polkadot (DOT), Kusama (KSM) and Cardano (ADA) lead the entire pack in GitHub commits. Experts believe that these three cryptocurrencies have potential and traders can rebalance their portfolios, taking this into account.
Polkadot and Kusama’s GitHub repository has increased considerably since 2020. DOT and KSM prices are largely unchanged over the past 30 days. With an increase in development activity, experts predict that the sentiment among holders is bullish, there is a higher number of features being shipped and less probability of the project being an exit scam.
These features fuel a bullish thesis for DOT and KSM. Polkadot network witnessed one of the largest spikes in its Total Value Locked (TVL), fueling a bullish sentiment among holders.
What to expect from DOT and KSM price
Polkadot is in a long-term downtrend that started in mid-May 2022. As long as DOT price fails to definitely close above the trendline, the downward trend is likely to stay intact. DOT proce has a resistance zone between $5.78 and $6.99, the weekly low and high, where the asset has spent a majority of its sideways action in the past seven months.
For the DOT price to reverse its trend, Polkadot needs to break out of this resistance zone and definitively close above the trendline. The three Exponential Moving Averages (EMAs) are currently acting as resistance at $6.06, $6.23 and $6.68.
These three levels are acting as immediate resistance for DOT and the bullish target is the resistance at $7.78 that has been a key level since 2022. DOT price climbed above this resistance between August and September 2022 and since then Polkadot has traded sideways.
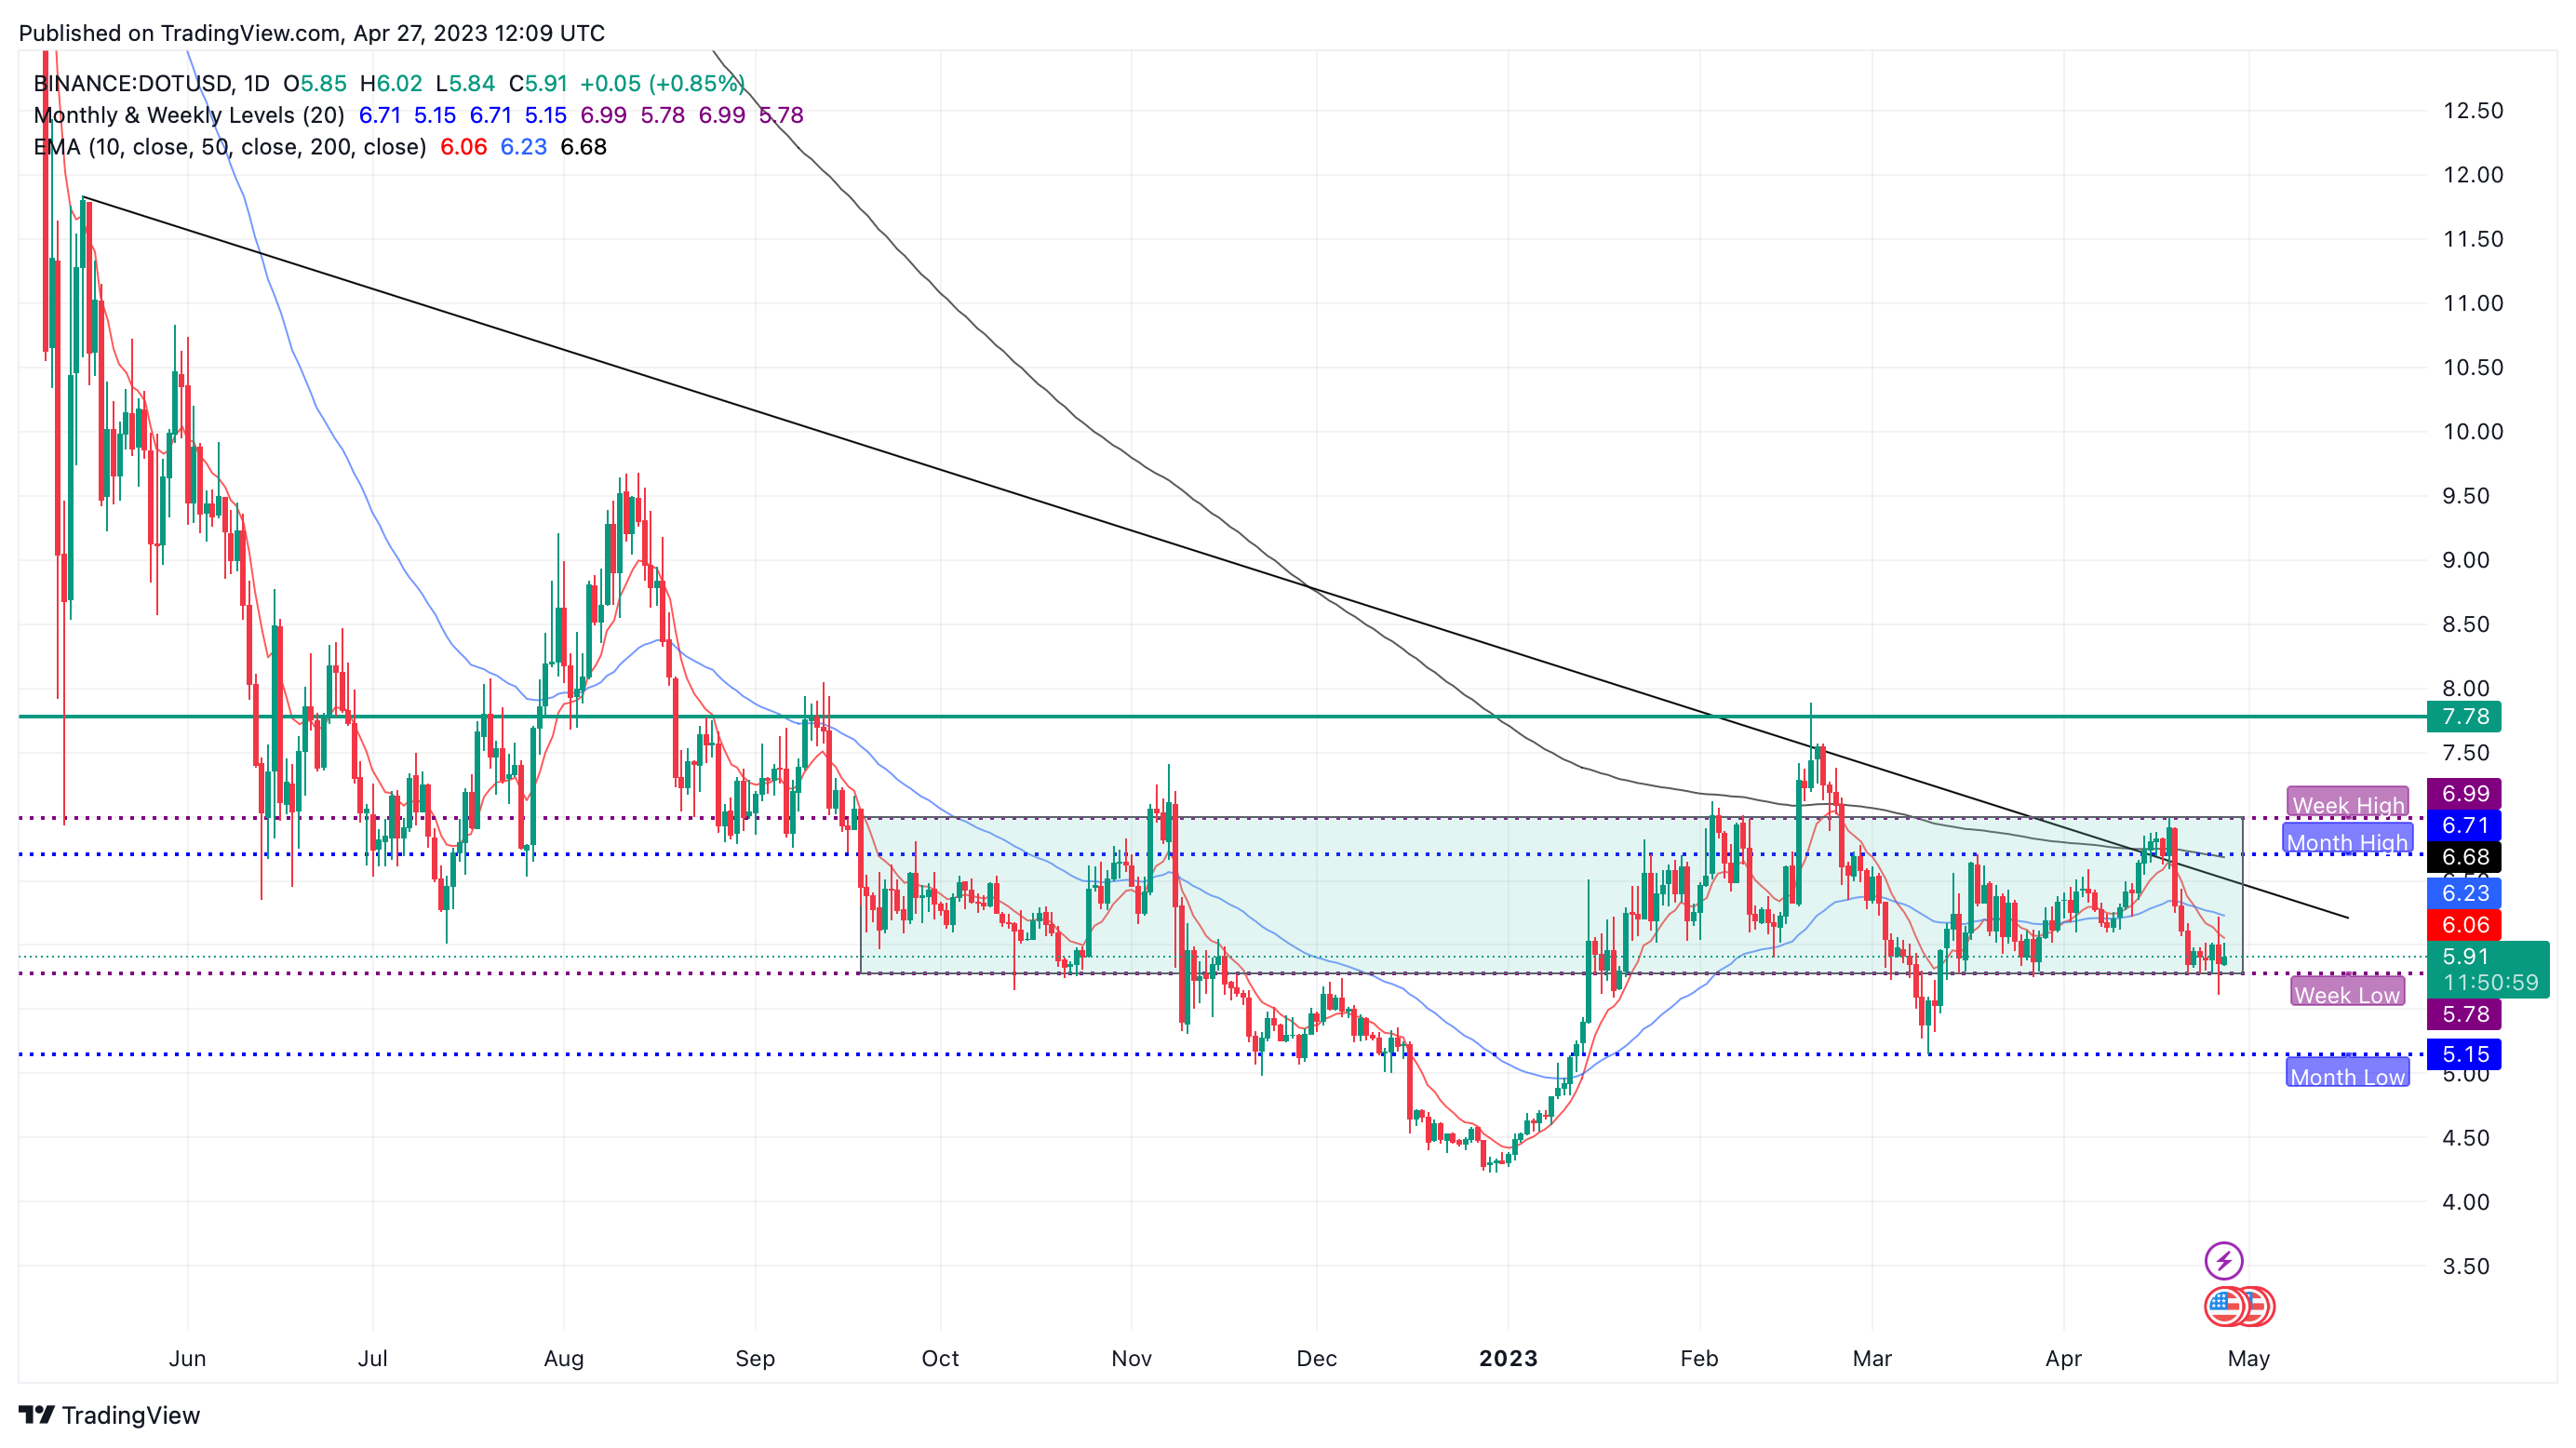
DOT/USD 1D price chart
If DOT price nosedives to the monthly low at $5.15, the bullish thesis is invalidated and the asset is likely to plummet lower to early 2023 levels between $4.50 and $5.
KSM price has been in a downtrend since March 2023 and the price plummeted after hitting a two-month high at $38 on April 17. KSM price corrected to levels previously seen in mid-March 2023.
KSM has a resistance zone between $31 and $35. KSM price needs to cross the resistance zone to break out of its sideways trend and a definitive close above the trendline could signal the reversal of the asset’s downtrend.
As of now there is no reversal candlestick pattern on the four-hour price chart and the asset is trading below its 10, 50 and 200-day Exponential Moving Averages (EMAs).
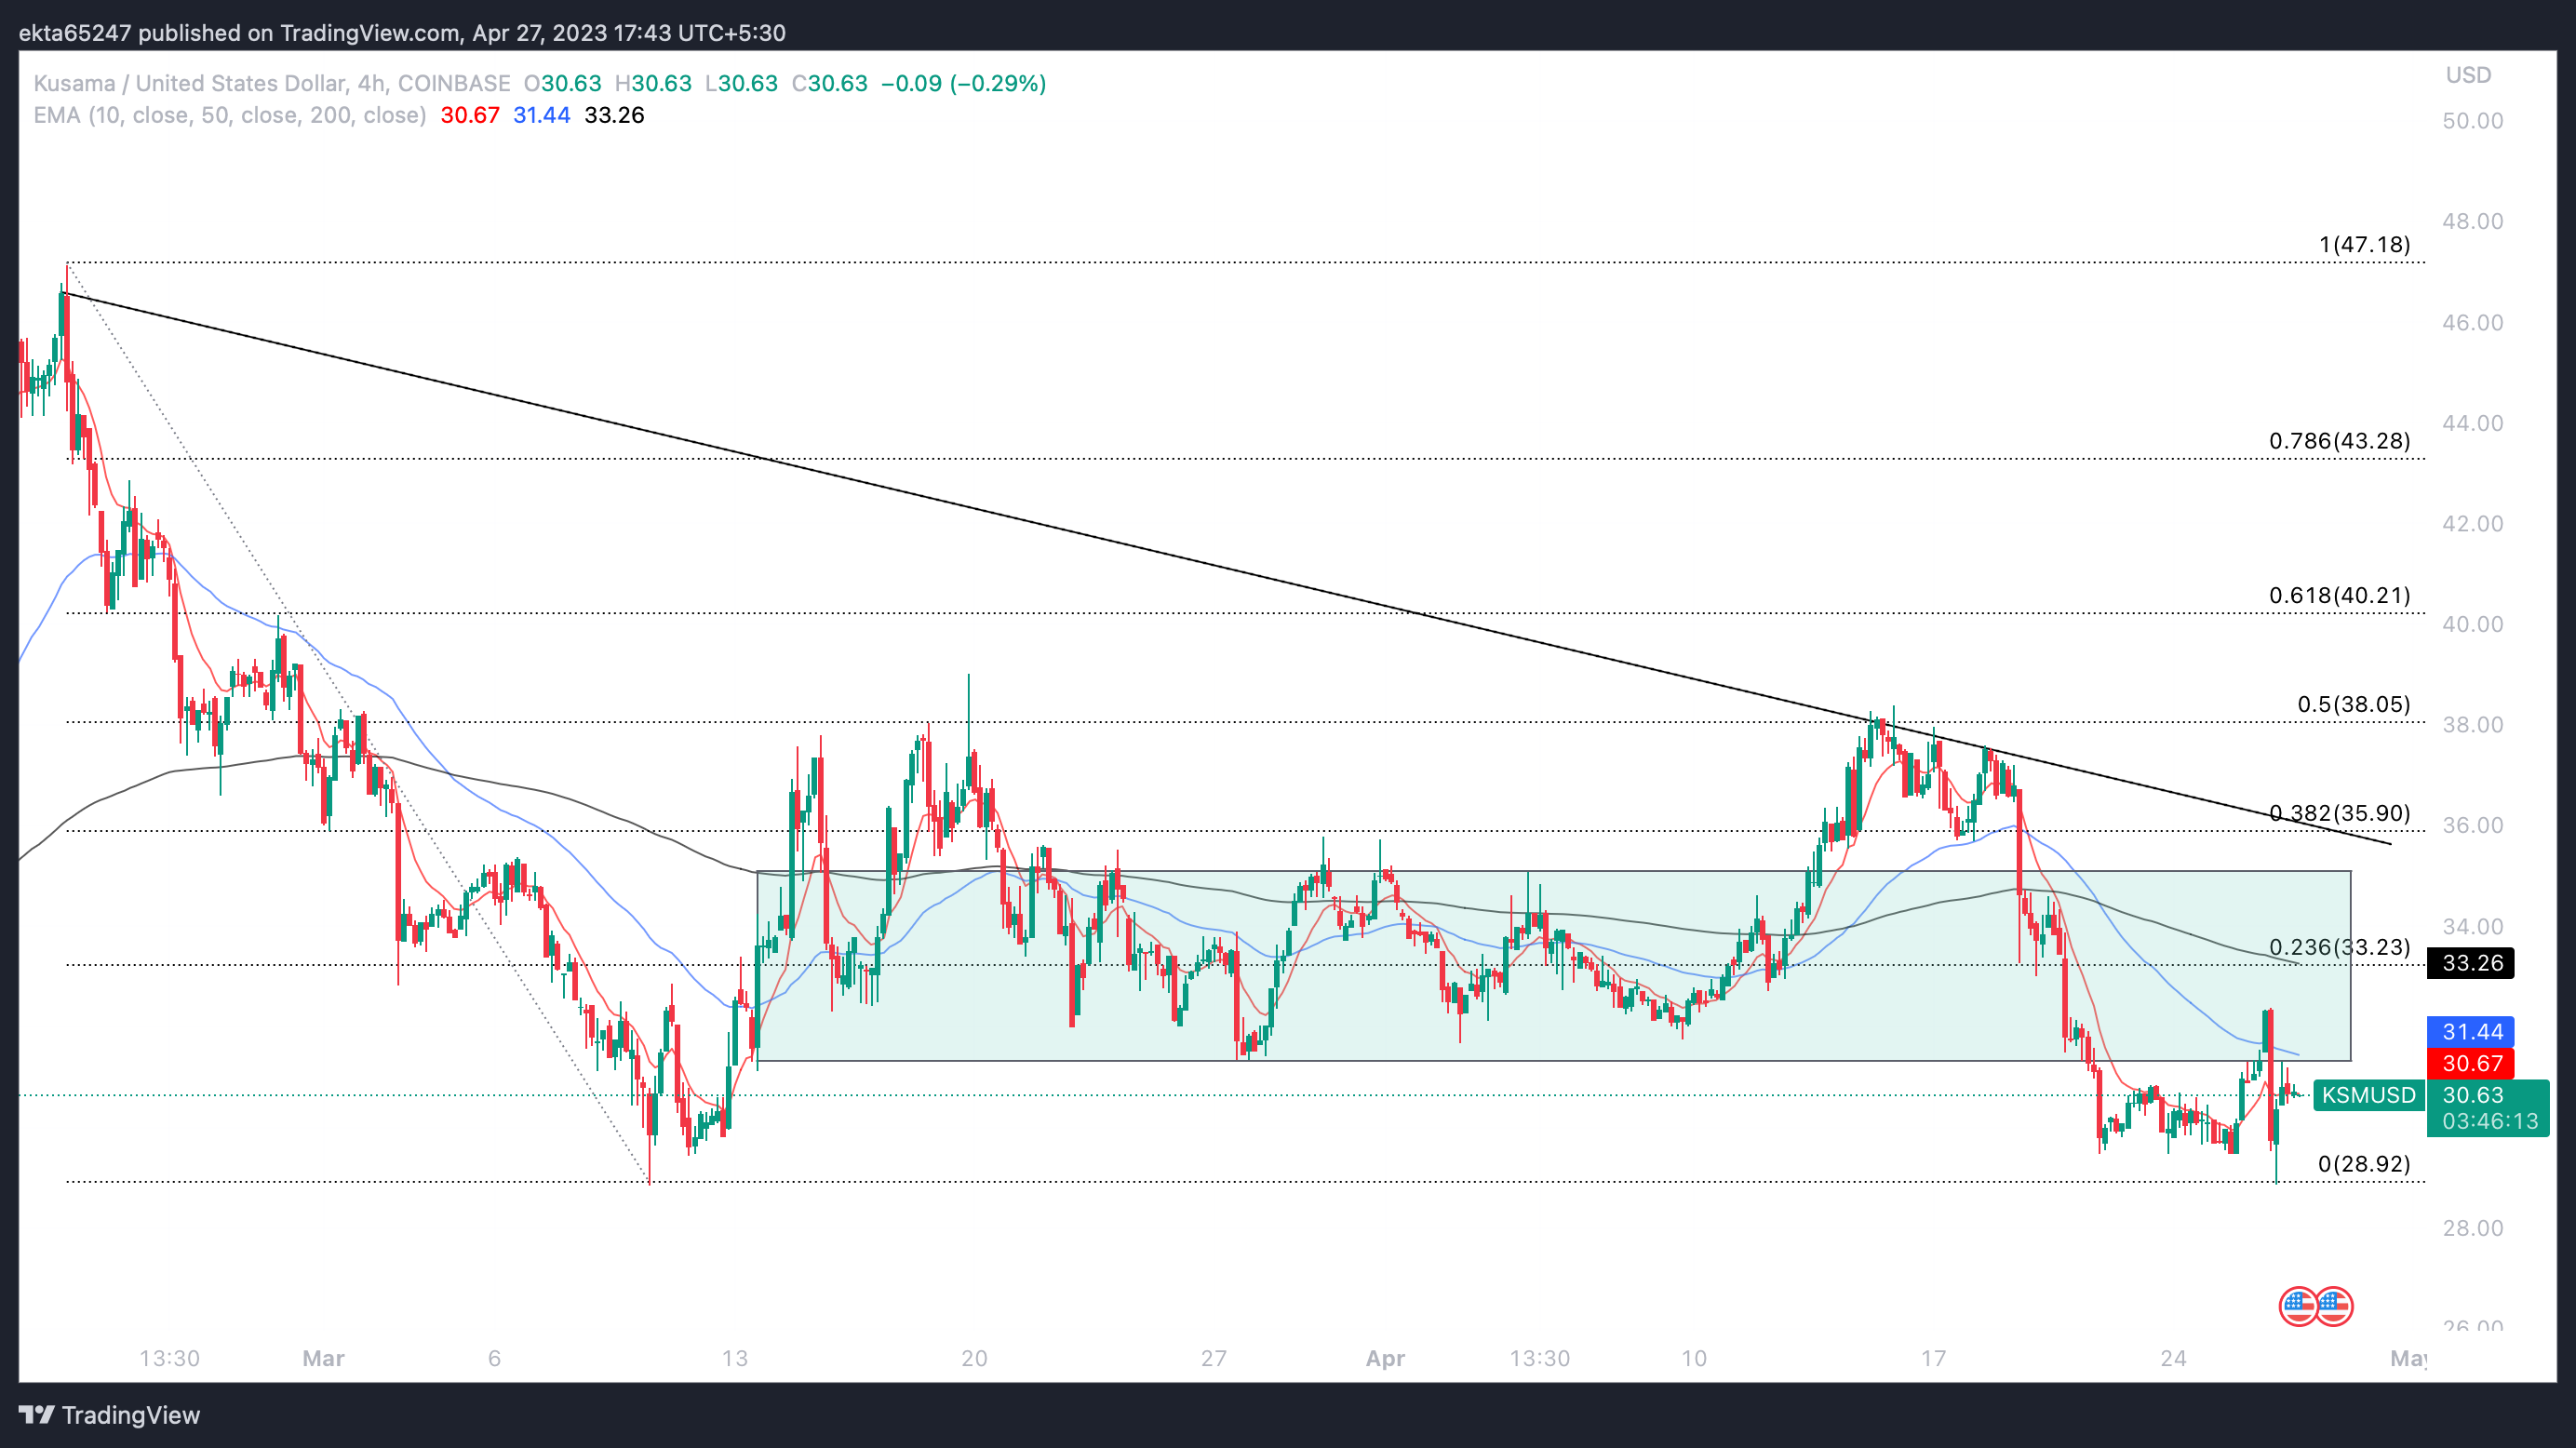
KSM/USD 4H price chart
A decline below the $28.92 level would invalidate the bullish thesis and signal further correction in KSM.
What experts predict in Cardano price
Akash Girimath, lead crypto analyst at FXStreet believes ADA price has laid a bull trap. The Ethereum-killer token is likely to trap bulls before a 20% upswing in its price. The expert believes a sweep of equal lows at $0.36 sets the stage for a 20% upswing in ADA.
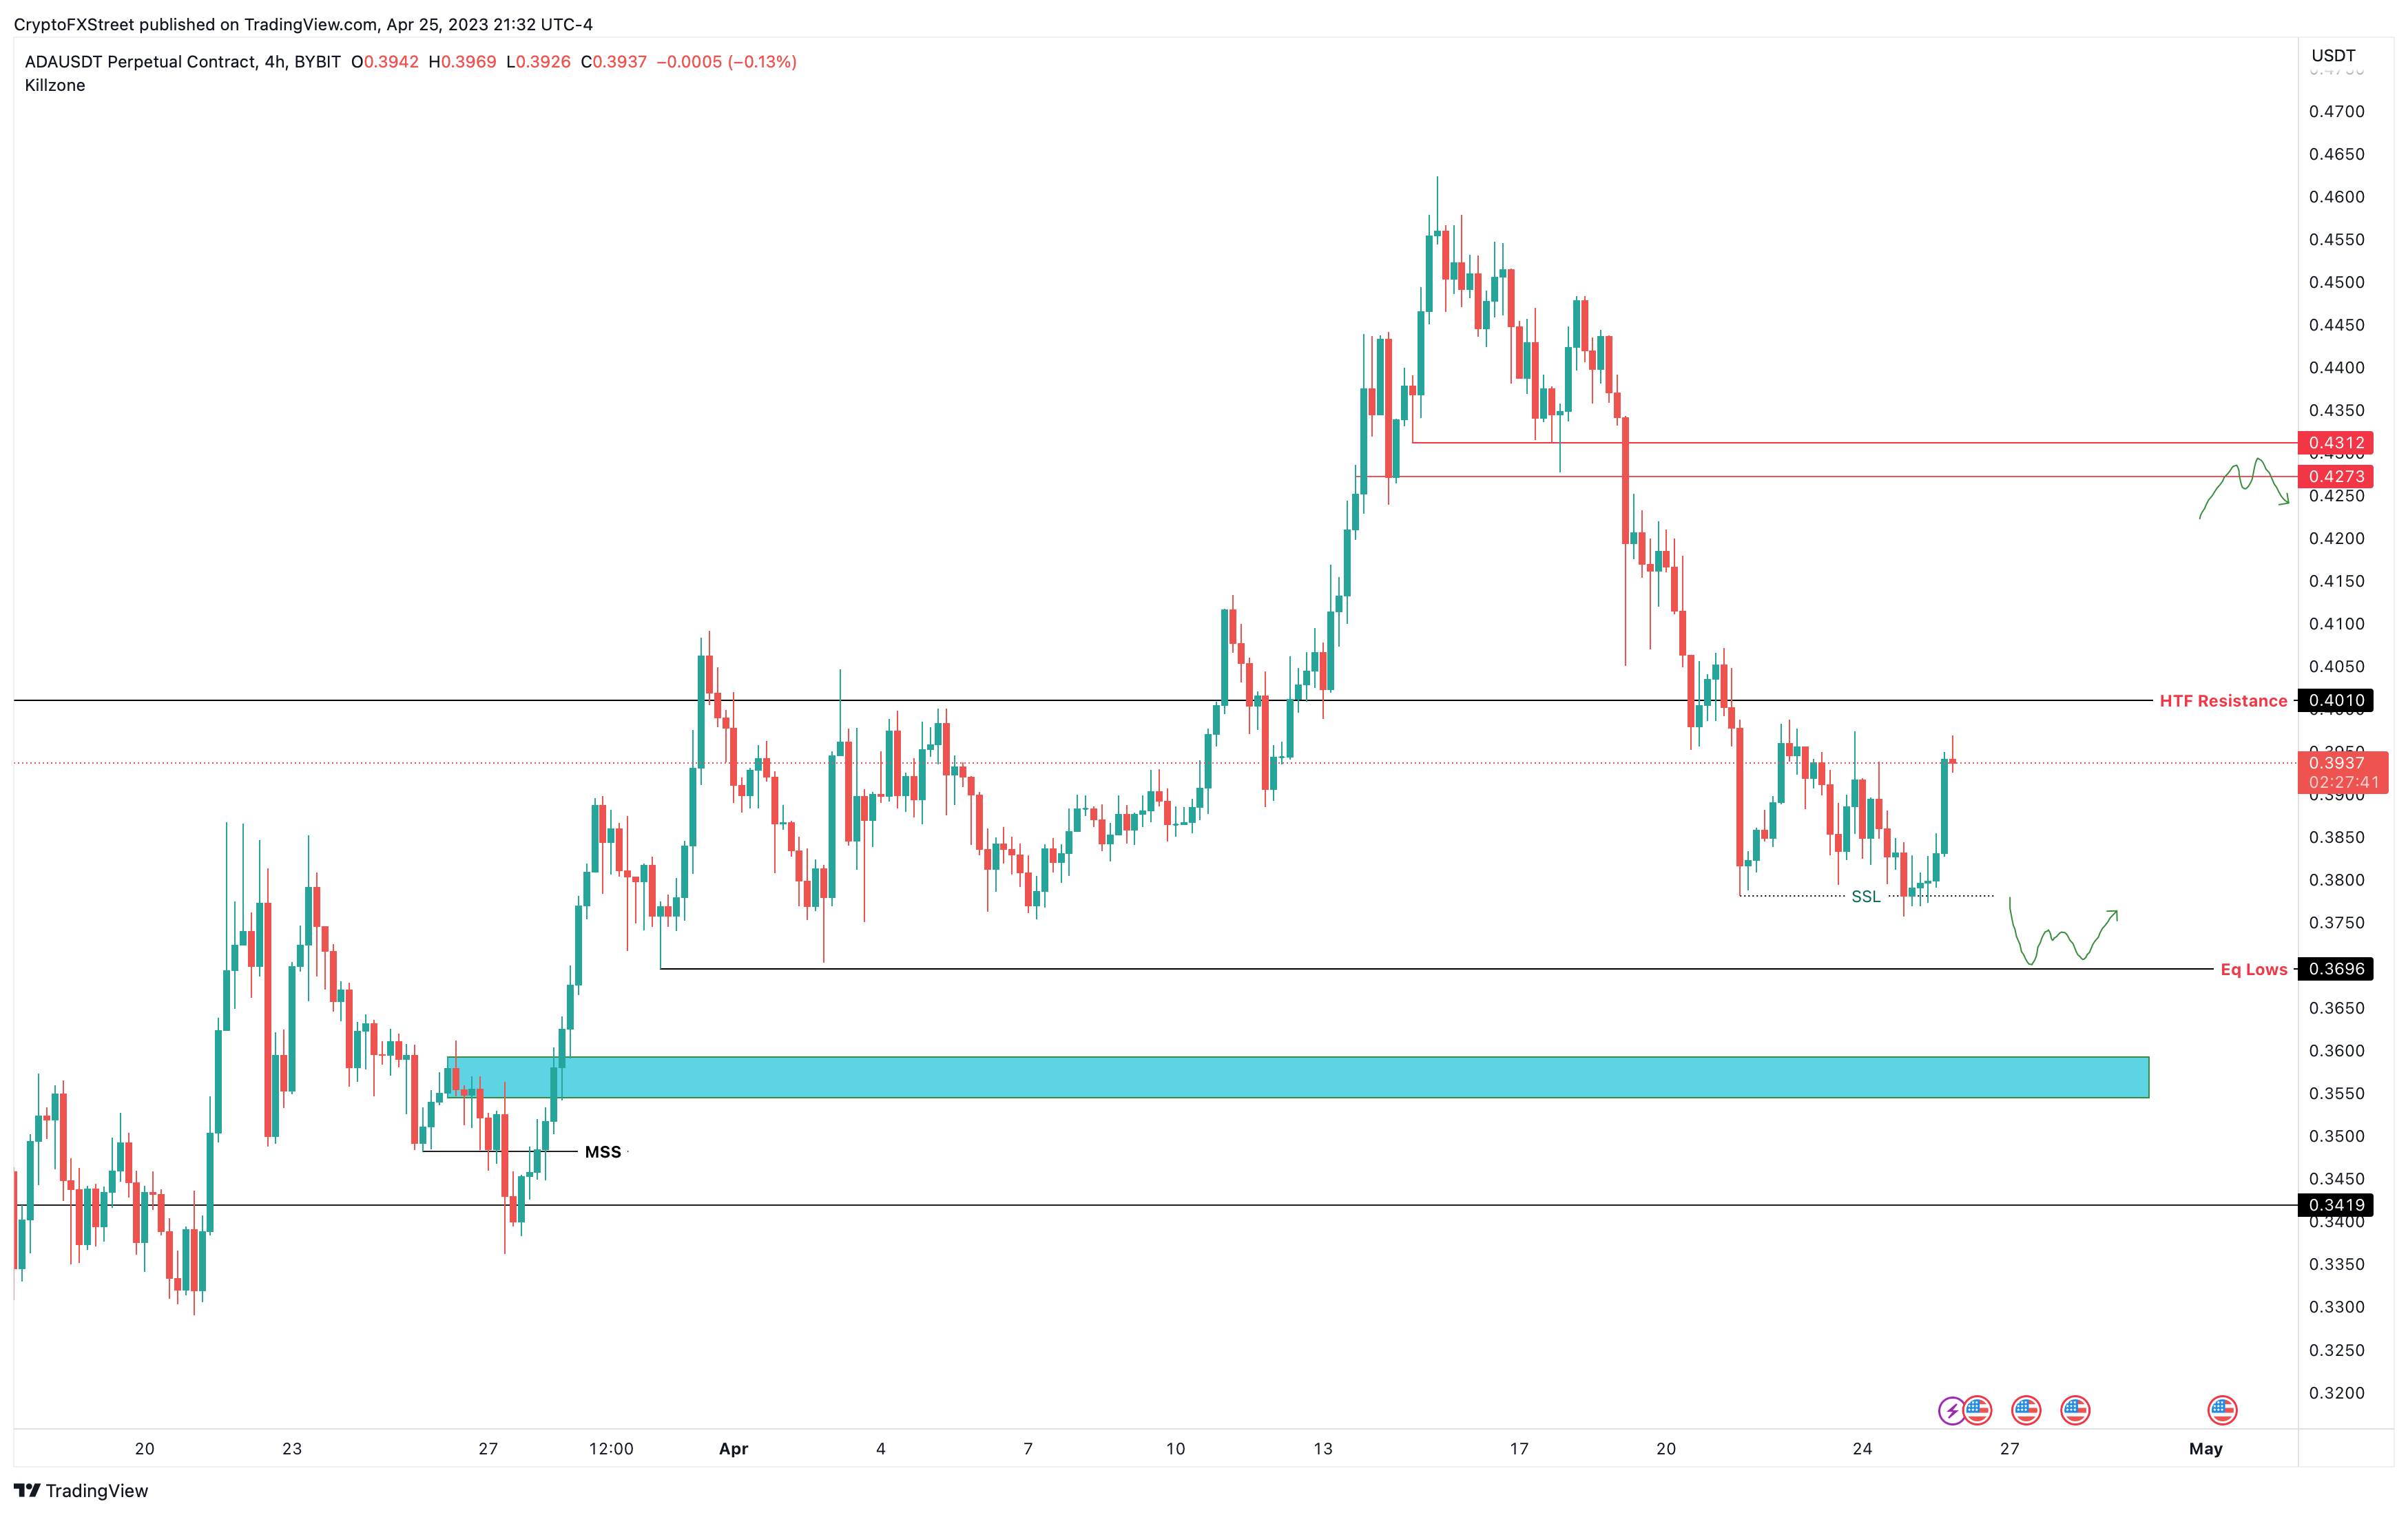
ADAUSDT Perpetual Contract 4H price chart
Girimath is bullish on Cardano and set a target of $0.431 for the asset. Find out more here.
Information on these pages contains forward-looking statements that involve risks and uncertainties. Markets and instruments profiled on this page are for informational purposes only and should not in any way come across as a recommendation to buy or sell in these assets. You should do your own thorough research before making any investment decisions. FXStreet does not in any way guarantee that this information is free from mistakes, errors, or material misstatements. It also does not guarantee that this information is of a timely nature. Investing in Open Markets involves a great deal of risk, including the loss of all or a portion of your investment, as well as emotional distress. All risks, losses and costs associated with investing, including total loss of principal, are your responsibility. The views and opinions expressed in this article are those of the authors and do not necessarily reflect the official policy or position of FXStreet nor its advertisers. The author will not be held responsible for information that is found at the end of links posted on this page.
If not otherwise explicitly mentioned in the body of the article, at the time of writing, the author has no position in any stock mentioned in this article and no business relationship with any company mentioned. The author has not received compensation for writing this article, other than from FXStreet.
FXStreet and the author do not provide personalized recommendations. The author makes no representations as to the accuracy, completeness, or suitability of this information. FXStreet and the author will not be liable for any errors, omissions or any losses, injuries or damages arising from this information and its display or use. Errors and omissions excepted.
The author and FXStreet are not registered investment advisors and nothing in this article is intended to be investment advice.
Recommended Content
Editors’ Picks

Shiba Inu eyes positive returns in April as SHIB price inches towards $0.000015
Shiba Inu's on-chain metrics reveal robust adoption, as addresses with balances surge to 1.4 million. Shiba Inu's returns stand at a solid 14.4% so far in April, poised to snap a three-month bearish trend from earlier this year.

AI tokens TAO, FET, AI16Z surge despite NVIDIA excluding crypto-related projects from its Inception program
AI tokens, including Bittensor and Artificial Superintelligence Alliance, climbed this week, with ai16z still extending gains at the time of writing on Friday. The uptick in prices of AI tokens reflects a broader bullish sentiment across the cryptocurrency market.

Bitcoin Weekly Forecast: BTC consolidates after posting over 10% weekly surge
Bitcoin price is consolidating around $94,000 at the time of writing on Friday, holding onto the recent 10% increase seen earlier this week. This week’s rally was supported by strong institutional demand, as US spot ETFs recorded a total inflow of $2.68 billion until Thursday.

XRP price could renew 25% breakout bid on surging institutional and retail adoption
Ripple price consolidates, trading at $2.18 at the time of writing on Friday, following mid-week gains to $2.30. The rejection from this weekly high led to the price of XRP dropping to the previous day’s low at $2.11, followed by a minor reversal.
Bitcoin Weekly Forecast: BTC consolidates after posting over 10% weekly surge
Bitcoin (BTC) price is consolidating around $94,000 at the time of writing on Friday, holding onto the recent 10% increase seen earlier this week.

The Best brokers to trade EUR/USD
SPONSORED Discover the top brokers for trading EUR/USD in 2025. Our list features brokers with competitive spreads, fast execution, and powerful platforms. Whether you're a beginner or an expert, find the right partner to navigate the dynamic Forex market.