Top 3 Coins Bitcoin, Ethereum and Ripple: BTC stifled below strong resistance – Confluence Detector
- Bitcoin critic Peter Schiff has said that BTC’s recent fall signifies the start of a bear market.
- Unlike BTC and ETH, XRP has had a bullish Monday.
- BTC is presently consolidating above $10,150.

Famous Bitcoin critic talks about BTC entering the bear market
Peter Schiff, a famous Bitcoin critic and gold advocate, has said that BTC’s recent fall marks a new bear market. In response to a tweet by Tyler Winklevoss (the co-founder of Gemini exchange), Schiff credited BTC’s surge over the last two months to a spillover effect from gold and a TV ad campaign.
Winklevoss said that BTC’s ability to stay above the $10,000 mark even during a dip indicates an oncoming breakout. To this, Schiff responded that the price level could easily be a pre-breakdown consolidation and did not necessarily signify a bottom.
#Bitcoin can just as easily be consolidating before the next breakdown. Consolidations after sharp moves typically continue the move that proceeds them. The more the 10K support level is tested the weaker it gets. Markets rarely give investors that many chances to buy the bottom.
— Peter Schiff (@PeterSchiff) September 6, 2020
In July, Schiff had predicted Bitcoin to drop below $9,000 and “crash” while gold would surge simultaneously. Upon being called out for his failed BTC crash prediction, Schiff responded that he was only wrong because of a strong performance residual effect. According to him, the flagship currency also benefited from the effect of a highly visible TV ad campaign by investment firm Grayscale.
I was right on #gold, but wrong on #Bitcoin. The latter did managed to get through resistance and rally up to $12K, thanks in large part to a ride on gold's coattails and a massive TV advertising buy by Grayscale. By falling back to $10K Bitcoin quickly returned to a bear market.
— Peter Schiff (@PeterSchiff) September 6, 2020
BTC/USD daily chart
-637351185358832921.png)
BTC/USD is currently consolidating above the $10,150-level. The sellers were apple to completely cancel out Sunday’s gains as the price fell from $10,258.41 to $10,194. Over the last six days, the price has fallen from $11,935.16 to $10,159.15, losing nearly $1,775 of its valuation.
As can be seen in the daily price chart, the bulls need to make up a lot of ground to take back control of the market. The Elliott Oscillator, with its five straight red sessions, suggests that the upcoming market sentiment is going to remain bearish. To prevent further downward movement, the $10,024.50 support level needs to hold firm.
ETH/USD daily chart
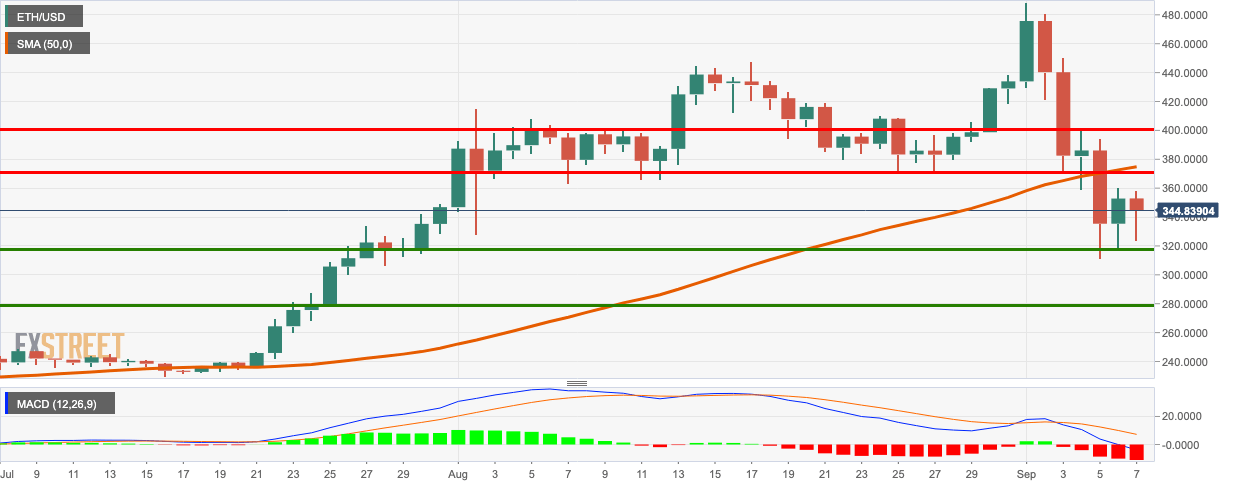
ETH/USD bears have taken this Monday following a bullish Sunday, as the price dropped from $352.85 to $348.63. The moving average convergence/divergence (MACD) shows increasing bearish momentum, so further price drop is expected. The bulls must defend the $319.25 support level to keep the price above $300.
XRP/USD daily chart
-637351186630446718.png)
XRP/USD has been sitting on top of the lower curve of the 20-day Bollinger Band. The bulls were able to gain some momentum as the price rose up slightly from $0.237 to $0.2427 over the last two days. Despite this short-term bullish correction, the overall market sentiment remains bearish. The William’s %R has been hovering in the oversold territory since 3rd September.
Top 3 Coins Confluence Detector
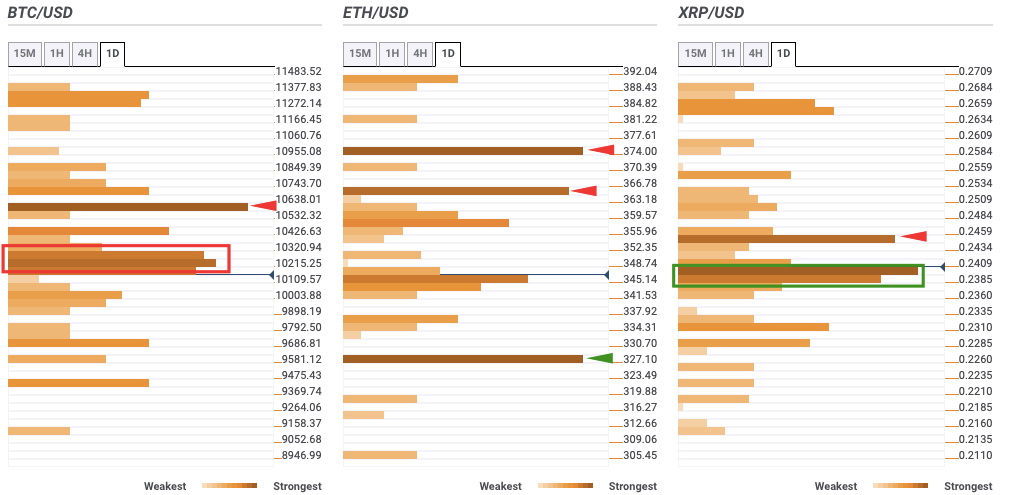
Bitcoin
BTC faces an immediate resistance stack between $10,215 - $10,300, which has the one-day Bollinger Band lower curve, one-day SMA 100 and one-day Fibonacci 38.2% retracement level.
After that, the $10,600 resistance level is highlighted by the Previous Month low and one-day Pivot Point resistance-two.
There is a lack of healthy support levels on the downside.
Ethereum
ETH has two notable resistance levels at $365 and $375. The former has the Previous Year high, while the latter has the one-day SMA 50 and one-month Fibonacci 61.8% retracement level. On the downside, we have one healthy support level at $328.50, which has the one-day Pivot Point support-one and the Previous Month low.
Ripple
XRP is sitting on a healthy support stack between $0.2385 and $0.24. This stack has the one-day Fibonacci 38.2% retracement level, one-day Bollinger Band lower curve and Previous Week low.
On the upside, we have strong resistance at $0.245, which has the one-day Previous High and one-month Pivot Point support-one.
Author

Rajarshi Mitra
Independent Analyst
Rajarshi entered the blockchain space in 2016. He is a blockchain researcher who has worked for Blockgeeks and has done research work for several ICOs. He gets regularly invited to give talks on the blockchain technology and cryptocurrencies.