- Bearish action across the Crypto board might extend until the weekend
- Technical scenarios have been developing sticking to expectations, taking prices back to targeted supports
The falls seen yesterday in the Cryptocurrency markets didn't catch us by surprise. First targets were reached but didn't hold as the bullish leg run out of gas, necessary making way for a consolidation phase.
Lower price levels are not out of the cards, but it is not the most probable scenario. The moving averages location, just above the price level in the 4-hour charts, favor a bearish lateral scenario, with a possible increase of volatility as the day advances.
BTC/USD 4H chart
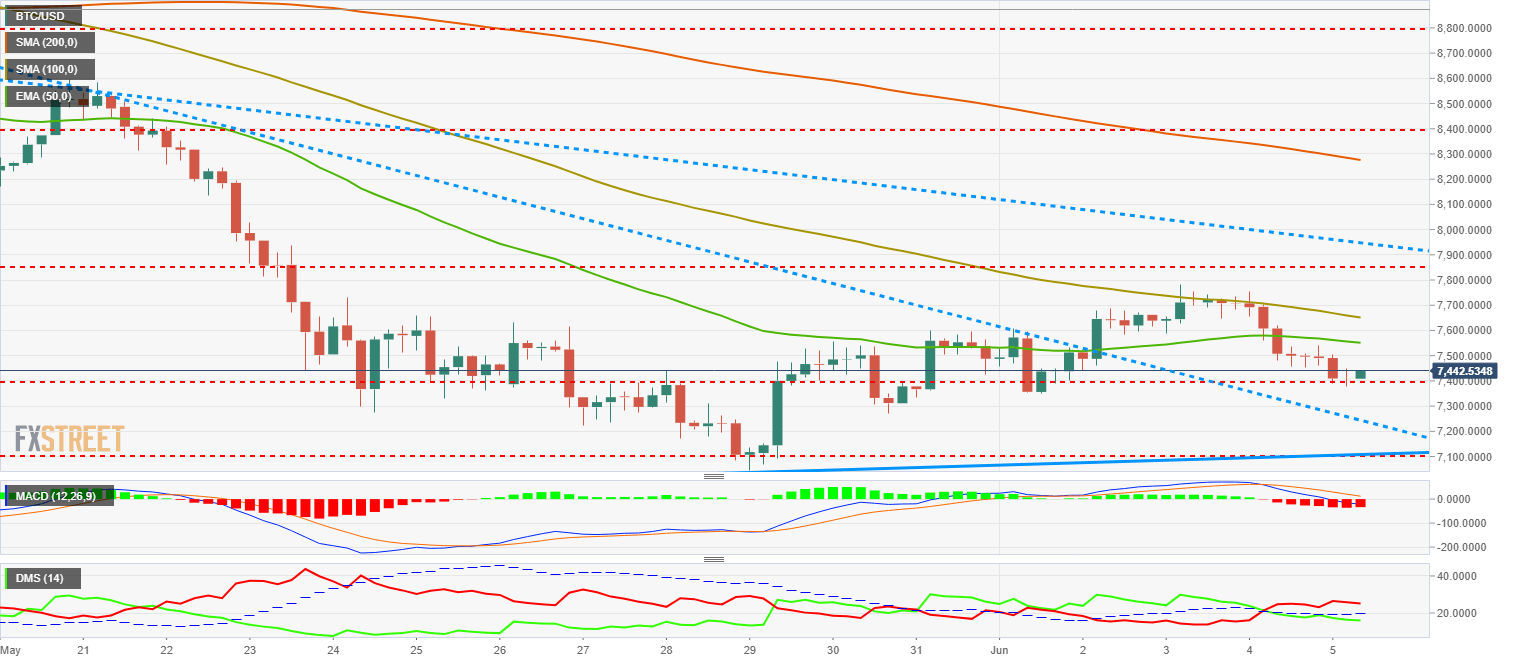
Bitcoin reached the primary target at $7400 during the early Asian trading session, right where BTC/USD has stopped its run. Bitcoin has left a Doji after a mid-sized candlestick, so we could see a turning formation during the American session.
On the upside, the first target is at the 50-EMA, located now at the $7550 mark, followed then by the 100-SMA at the $7650 level. Breaching that level would be very bullish for BTC/USD, although it is not the most likely scenario. Further above, there is another price resistance level at $7870 that would leave Bitcoin at the doors of a technically important trendline at $7950.
On the bearish side, the first support is at the current price ($7400), with a possible extension down to $7359. If that level is lost, Bitcoin would fall straight down to the more accelerated trendline that is located at the $7230 level.
MACD in the Bitcoin 4-hour chart is still showing some room to cover on the bearish side, particularly if we consider that it is trading on the positive side of the indicator, losing some strength. Potential bearish lateral moves look quite likely with an increase of volatility, which could lead to a change of direction.
Directional Movement Index in the same chart is showing buyers in retreat since the $7700 level was reached. Sellers, on the other hand, have been increasing their positions as the price action started weakening, but have quieted in the last hours, not showing much confidence in more falls.
ETH/USD 4H chart
-636637897551404402.png)
Ethereum fell down yesterday to $580 just before bouncing to the price congestion support at $587. However, the 50-EMA at the $590 mark was lost and has been barely recovered at the time of writing this article.
ETH/USD is stuck in a tight falling wedge, barely in a $70 range, where the 50-EMA, the 100-SMA and two significant price levels ($587 and $565) meet.
Given the current scenario, every level is important, with the most important one to track on the upside being the 100-SMA located at the $602 mark and the falling wedge superior trendline at $605. If those levels are broken to the upside, Ethereum would enter a much more positive scenario that would quickly take the $620 mark back.
On the bearish side, the first support is on the 50-EMA at $590, which would take the price back to the inferior trendline located at $570. If that level is lost, ETH/USD would enter a scenario open to new falls, with the first support being very close to the $567 mark. That would be the last stop before very important falls that would target $520.
MACD in the Ethereum 4-hour chart shows how the bearish movement is losing steam and both the mid-line and the signal one are flattening quickly, proposing a bullish cross attempt. This is a very premature try and will probably fail. We should still consider this as lateral with a neutral profile.
Directional Movement Index in the same chart is gifting us another setup favorable for confusion. Buyers and sellers are close to being even, with a profile that proposes an increase on the buyers' side. Technical setups such as this one usually allow confusing movements that might result in a contrarian outcome. The outlook is lateral with bullish potential, but we should wait and see.
XRP/USD 4H chart
-636637897841418319.png)
Ripple is trading inside a wide-open technical scenario, but with multiple resistances and supports complicating any development. The indicators are set up quite differently than the other two assets analyzed.
On the upside, the first resistance is located at $0.66, immediately followed by the trendline located at $0.67 that protects the doors to a net bullish territory. We can find another price congestion resistance at $0.679, which strengthens the wall behind the bulls paradise.
On the downside, the first support is at the 50-EMA ($0.635), followed by a price congestion support at $0.63. If that level was lost, the bearish target would clearly be at $0.60.
MACD in the Ripple 4-hour chart shows a similar profile than the Ethereum one, although a bit more advanced. This is an optimal profile for a bullish cross, but also for a bull trap. We recommend to wait to confirm the breakout and latter consolidation before taking any positions.
Directional Movement Index in the same chart still gives some edge to the buyers, that might take back the ADX line. If that happens, it would be a very strong bullish signal. Sellers have increased a lot during the last dip, but are losing some strength today, not showing much confidence to more falls.
Information on these pages contains forward-looking statements that involve risks and uncertainties. Markets and instruments profiled on this page are for informational purposes only and should not in any way come across as a recommendation to buy or sell in these assets. You should do your own thorough research before making any investment decisions. FXStreet does not in any way guarantee that this information is free from mistakes, errors, or material misstatements. It also does not guarantee that this information is of a timely nature. Investing in Open Markets involves a great deal of risk, including the loss of all or a portion of your investment, as well as emotional distress. All risks, losses and costs associated with investing, including total loss of principal, are your responsibility. The views and opinions expressed in this article are those of the authors and do not necessarily reflect the official policy or position of FXStreet nor its advertisers. The author will not be held responsible for information that is found at the end of links posted on this page.
If not otherwise explicitly mentioned in the body of the article, at the time of writing, the author has no position in any stock mentioned in this article and no business relationship with any company mentioned. The author has not received compensation for writing this article, other than from FXStreet.
FXStreet and the author do not provide personalized recommendations. The author makes no representations as to the accuracy, completeness, or suitability of this information. FXStreet and the author will not be liable for any errors, omissions or any losses, injuries or damages arising from this information and its display or use. Errors and omissions excepted.
The author and FXStreet are not registered investment advisors and nothing in this article is intended to be investment advice.
Recommended Content
Editors’ Picks
Crypto Today: Bitcoin is less than 10% away from all-time high as Ethereum ETF approval anticipation brews

Bitcoin trades around $68,000 early on Monday, less than 10% away from its all-time high of $73,777 on Binance. Ethereum ETF anticipation brews among traders and Ether investment products see inflow of over $45 million in the past week.
Ripple lawsuit settlement likely soon, says Brad Garlinghouse, XRP hovers around $0.60

Ripple (XRP) trades around a key psychological level of $0.60, early on Monday. The altcoin recently made headlines for its highest weekly gain of 2024, over 40%. XRP sustained nearly 21% of the gains from the last seven days.
Solana could cross $200 if these three conditions are met

Solana’s total value locked climbs 18% in July to $5.38 billion, as seen on DeFiLlama. Solana sustains over 20% gains in the past seven days, corrects nearly 3% on Monday. Active addresses and new address count in the Solana network have increased throughout July.
ALT, WLD, ENA, ID set for $200 million token unlocks next week

The crypto market is set to experience another wave of token unlocks next week, with Altlayer (ALT), Worldcoin (WLD), Ethena (ENA), and Space ID (ID) set for a combined token unlock worth about $200 million.
Bitcoin: Will BTC continue its bullish momentum?

Bitcoin (BTC) price increased by 5.5% this week until Friday after breaking above a descending trendline. Currently, it is trading slightly higher by 0.23% at $64,166.