- Technical indicators are pointing to a bullish movement in Bitcoin and Ethereum
- Ripple and Ethereum have drilled yesterday's lows, now on a limit situation
It is not easy to propose a bullish technical setup with the big falls that the main Cryptocurrencies are experiencing, but it's in these times where the risk is worth taking if we stuck to technical analysis.
The charts, particularly the Bitcoin one, are on extreme situations and any dip will take us to a bearish technical scenario, and likely a very volatile one. But it's in this kind of situations that market forces like to act, as it's where the stops tend to be more close.
BTC/USD 4H chart
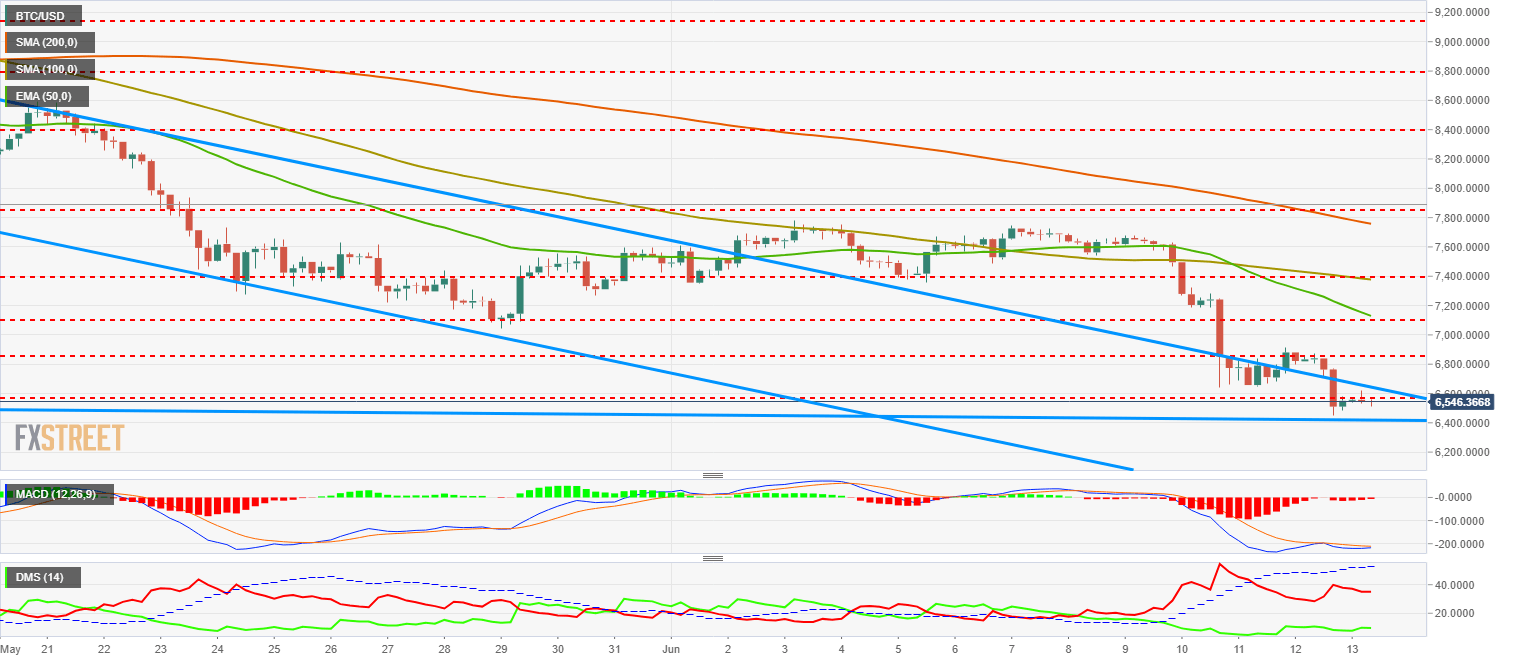
Bitcoin buyers are at extremely low levels, only seen three times since 2015, which involved each and every time bullish swings. The MACD structure, as we will see, is setting up a pattern very favorable for the bulls.
With this outlook, we saw yesterday another bear-dominated trading day, that took BTC/USD back to the support level at $6565 after projecting the movement back to the major long-term trendline that meets $6430.
It's in this last level where BTC/USD finds its first support, the last one before the void that would take the price straight back to $5864, February lows and the triggering level that would definitely take Bitcoin back to a long bearish period that could last for months.
If, on the other hand, Bitcoin bulls are able to initiate a run, the immediate resistance is located at the trendline of the bearish channel that is now located at $6644. Breaking that one would open a totally different scenario for the second half of the year. The following resistance is at $6855, a price congestion level, and the final short-term target is at $7090, where a price congestion resistance and the 50-EMA meet.
MACD in the Bitcoin 4-hour chart followed the script and moved to the downside yesterday. The pattern shows that the next step is a bullish movement. If that bullish pattern fails, it would be an extremely signal of weakness that should make us re-think our positioning on this asset.
Directional Movement Index in the same chart shows the sellers diminishing their activity while the buyers are at multiple-month levels, with an increase in its activity in the last hours.
ETH/USD 4H chart
-636644823388046241.png)
Ethereum is finding itself in a very similar situation than Bitcoin. Technical levels at the lows of the current setup, buyers at the bottom and potential bullish swing signals.
After yesterday's bearish movement, ETH/USD reached the $480-$460 level, where a price congestion support and a mid-term trendline that both place the final barrier before opening up a scenario that would likely target the lows from early April, in the $360 area. A terminal movement at the $425-$450 range is not out of the cards.
If the bullish pattern is completed, the first resistance at $510 where a major trendline coming from the end of April. If that resistance area is broken, the next target is at the $520 price congestion level, and above there, at $555, where the roof of the channel and the 50-EMA meet.
MACD in the Ethereum 4-hour chart shows a similar setup than the Bitcoin one. MACD failure pattern developing, with the statistical most likely outcome being a bullish swing. If that doesn't hold, it would be a signal of extreme weakness and strong falls would be very likely.
Directional Movement Index in the same chart shows the sellers retreating but heading to confirm the bearish cross of the ADX. Buyers are at very low levels but with an increasing profile. ADX is signalling a very strong trend, so the surge of strong volatility is not out of the cards.
XRP/USD 4H chart
-636644823878834165.png)
Ripple is also finding itself on a statistically favors rises. Bears have taken Ripple back to the $0.5432 level, new relative lows since April and a level that needs hold to avoid getting back to a scenario that would take XRP/USD straight back to $0.50. Further down, following targets are at $0.45, April lows and last barrier before getting onto a fully bearish period.
If the technical pattern continues and bulls are able to deliver, the first weak resistance is at $0.56, which if broken would leave $0.585 as the next target. The final target for this potential bullish scenario would be $0.60, the third resistance where the moving averages will likely converge in the short-term.
MACD in the Ripple 4-hour chart is following the drawn pattern, which would give way to a bullish outlook if its develops further. If that fails, it would a signal of extreme weakness and the falls could potentially be very big.
Directional Movement Index in the same chart shows sellers retreating but still at high levels, while buyers show a very flat profile. ADX is still at levels that mean very strong trend, and might carry an extra dose of volatility if they break critical levels on any of both sides.
Information on these pages contains forward-looking statements that involve risks and uncertainties. Markets and instruments profiled on this page are for informational purposes only and should not in any way come across as a recommendation to buy or sell in these assets. You should do your own thorough research before making any investment decisions. FXStreet does not in any way guarantee that this information is free from mistakes, errors, or material misstatements. It also does not guarantee that this information is of a timely nature. Investing in Open Markets involves a great deal of risk, including the loss of all or a portion of your investment, as well as emotional distress. All risks, losses and costs associated with investing, including total loss of principal, are your responsibility. The views and opinions expressed in this article are those of the authors and do not necessarily reflect the official policy or position of FXStreet nor its advertisers. The author will not be held responsible for information that is found at the end of links posted on this page.
If not otherwise explicitly mentioned in the body of the article, at the time of writing, the author has no position in any stock mentioned in this article and no business relationship with any company mentioned. The author has not received compensation for writing this article, other than from FXStreet.
FXStreet and the author do not provide personalized recommendations. The author makes no representations as to the accuracy, completeness, or suitability of this information. FXStreet and the author will not be liable for any errors, omissions or any losses, injuries or damages arising from this information and its display or use. Errors and omissions excepted.
The author and FXStreet are not registered investment advisors and nothing in this article is intended to be investment advice.
Recommended Content
Editors’ Picks

Top 3 Price Prediction Bitcoin, Ethereum, Ripple: Bulls target $100,000 BTC, $2,000 ETH, and $3 XRP
Bitcoin (BTC) is stabilizing around $95,000 at the time of writing on Wednesday, and a breakout suggests gains toward $100,000. Ethereum (ETH) and Ripple (XRP) followed BTC’s footsteps and hovered around their key levels.

Tether mints 3 billion USDT on Ethereum and TRON as markets stabilize
Tether ramps up its minting activity amid surging demand for stablecoins, often signaling heightened trading and liquidity needs. The issuer of the leading stablecoin by market capitalization has minted 2 billion USDT on Ethereum and an additional 1 billion USDT on the TRON network.

SEC delays decision on Franklin Templeton’s spot XRP ETF to June 2025
The Securities and Exchange Commission (SEC) has postponed its decision on Franklin Templeton’s spot XRP ETF, extending the review period to June 17, 2025. XRP traded at approximately $2.24 at press time, rising 7% over the past week, according to CoinGecko.

Trump Media announces new token launch and native crypto wallet in latest Shareholder letter
Trump Media unveils plans to launch a utility token and crypto wallet to monetize Truth Social and expand its streaming services. Markets react with a 10% drawdown on the Solana-hosted official TRUMP memecoin.

Bitcoin Weekly Forecast: BTC consolidates after posting over 10% weekly surge
Bitcoin price is consolidating around $94,000 at the time of writing on Friday, holding onto the recent 10% increase seen earlier this week. This week’s rally was supported by strong institutional demand, as US spot ETFs recorded a total inflow of $2.68 billion until Thursday.

The Best brokers to trade EUR/USD
SPONSORED Discover the top brokers for trading EUR/USD in 2025. Our list features brokers with competitive spreads, fast execution, and powerful platforms. Whether you're a beginner or an expert, find the right partner to navigate the dynamic Forex market.