- Weekend price plunge prevents dangerous full control of the market by Bitcoin.
- Ripple is left in a fragile situation that could accelerate his fall from the Top 3 podium.
- The scenario after the debacle invites to think about an increase in volatility after the Bitcoin halving event.
There are less than 12 hours left for the Bitcoin halving, and the last few hours have reflected the tension and degree of confrontation at the foundation of the cryptocurrency market.
This weekend was once again the scene of a bearish shock in the cryptocurrency market. Causing a sudden drop during days of low liquidity is typical and unoriginal, yet effective.
From a technical analysis view, the movement has had significant consequences, not so much for the market side which has fiat currencies as its benchmark, but for the internal balance of power between crypto-assets.
Last week Bitcoin launched a major offensive to increase its market share. The attack achieved its goal, and for a few hours, the king of cryptocurrencies moved through a new scenario that gave him a critical control of the crypto market.
This technical achievement brought the market structures to a critical point because it could unbalance the capital balance too much and endanger many projects in the Altcoin segment.
And the market reacted.
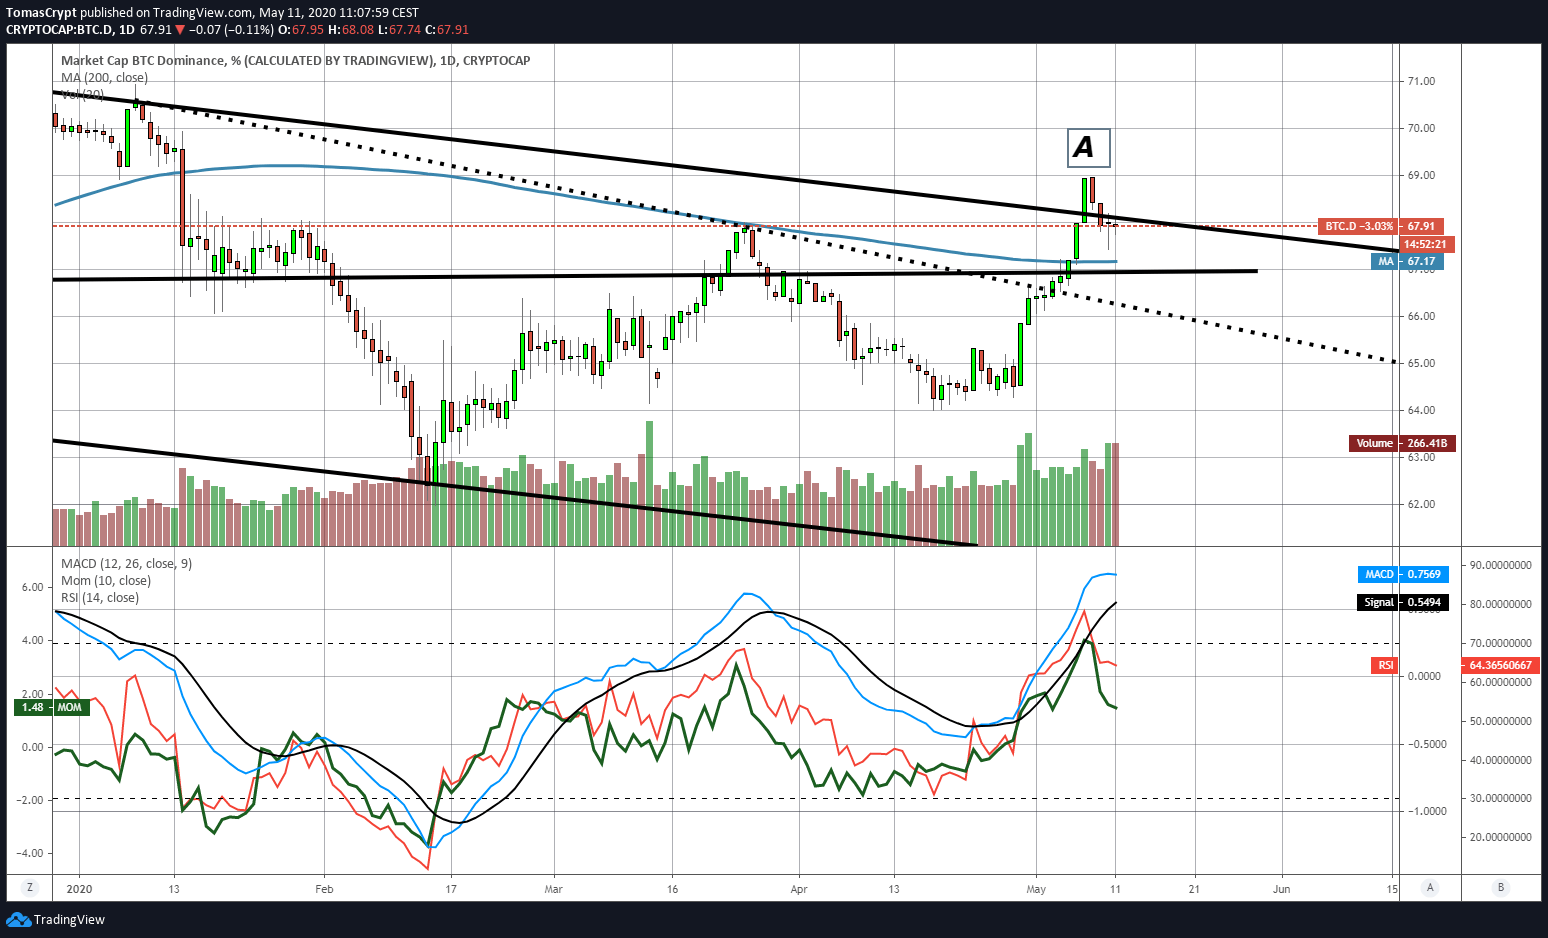 As we can see in the Bitcoin dominance graph, the market replicated the upward break of the long-term downstream channel ceiling (A) and after Saturday night's flash-crash the Bitcoin market share level is back to the previous scenario.
The market will now be very attentive to these technical levels, and volatility will likely increase in the short term. A healthy market is a diversified market, and an over-concentration of capital in Bitcoin would eventually have negative consequences in the long run.
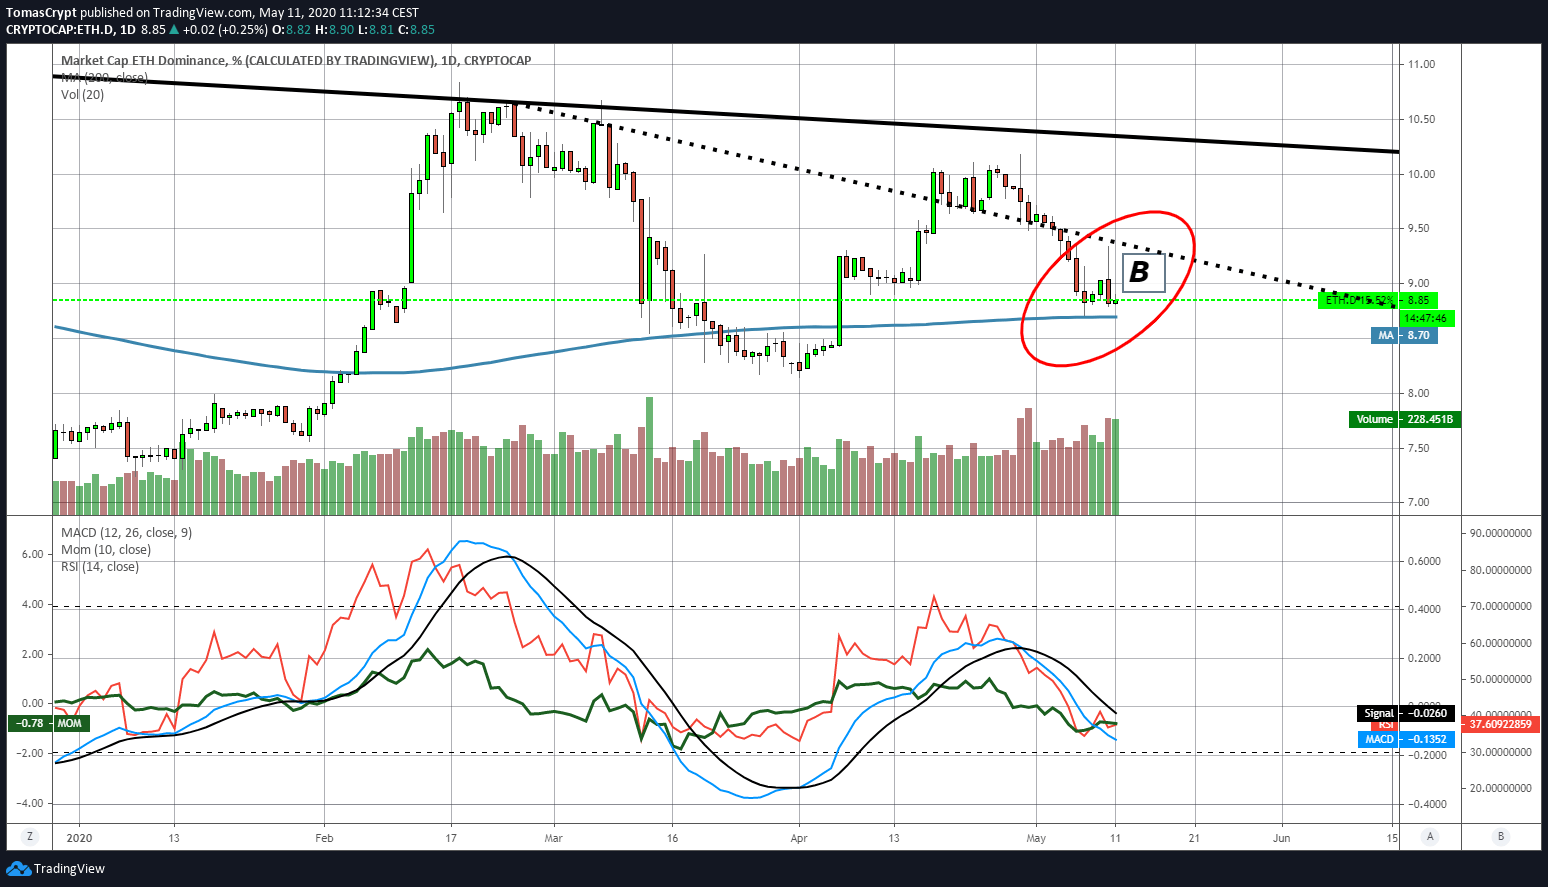
In the Ether dominance chart (B), we see the confirmation of this event. At first, sales concentrated on Bitcoin, and this had a definite impact on the dominance level of Ether. In a few minutes, the market swung towards the Ether. Later, the fear spread and reached all the assets of the crypto ecosystem.
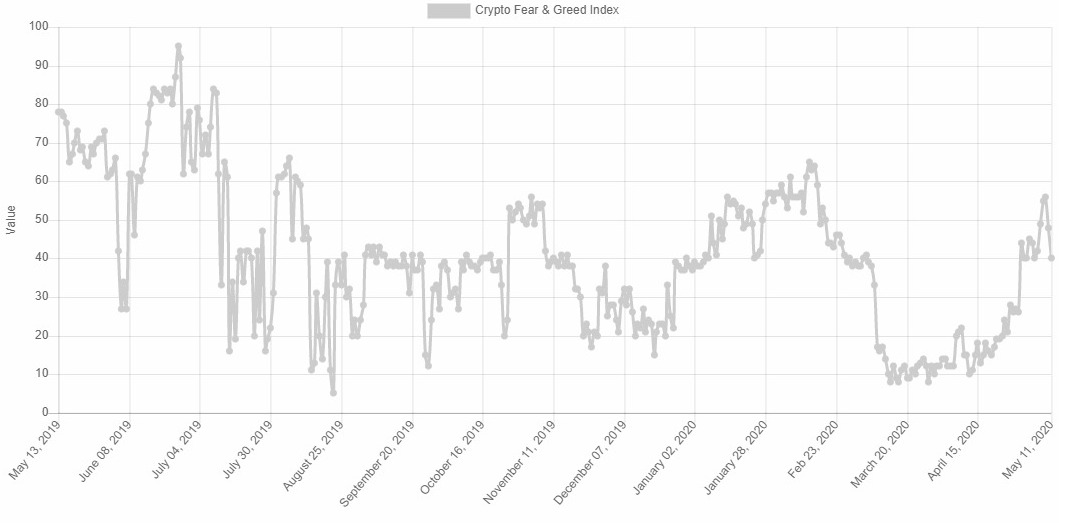
 The Fear & Greed indicator prepared by alternative.me clearly shows the effect of this "fear bomb", with a drop of nearly 20% from last Friday's levels. The indicator is now at level 40 and is entering the fear zone again.
ETH/BTC Daily Chart
The ETH/BTC pair is currently trading at the price level of 0.02158. On Sunday's candlestick, the collapse in the Bitcoin price took the price level to 0.023, but when the sell-off extended the valuation of the Ether against the Bitcoin returned to its starting levels.
Above the current price, the first resistance level is at 0.0217, then the second at 0.022 and the third one at 0.0228.
Below the current price, the first support level is at 0.0202, then the second at 0.0186 and the third one at 0.018.
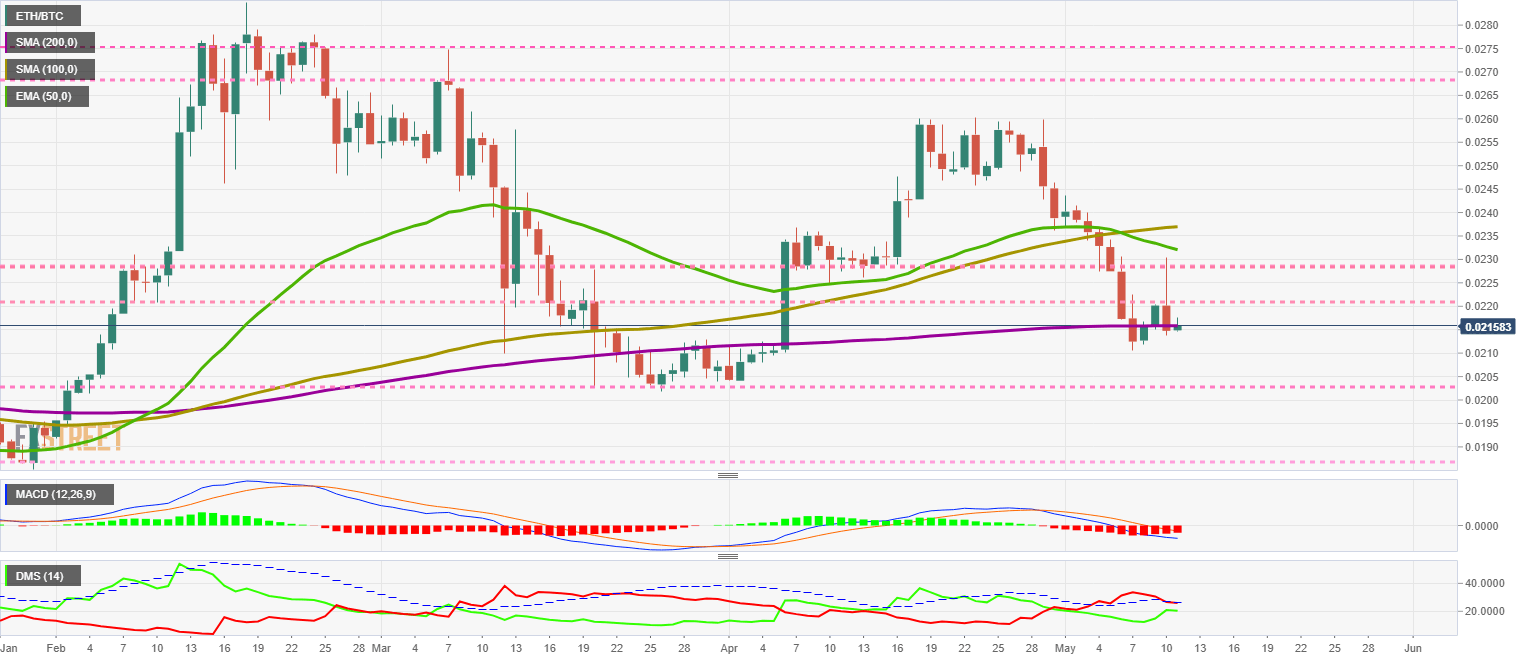
The MACD on the daily chart is losing some of its bearish potentials, but the price will tend to move lower in the next few sessions.
The DMI on the daily chart shows the bearish side below the ADX line and disabling the bullish pattern. The bulls have gained strength despite not being reflected in the price and may even launch an attack for control of the ETH/BTC pair in the short term.
BTC/USD Daily Chart
The BTC/USD pair trades at the price level of $8601 and recovers approximately 50% of its losses in the sell-off. The technical impact on the Bitcoin price against the US dollar has been zero. The price remains in the previous bullish scenario and above the main moving averages. Technical indicators do show a risk that this situation may change and that BTC/USD may enter a correction mode in the next few sessions.
Above the current price, the first resistance level is at $8700, then the second at $9150 and the third one at $9650.
Below the current price, the first support level is at $8450, then the second at $8200 and the third one at $8000.
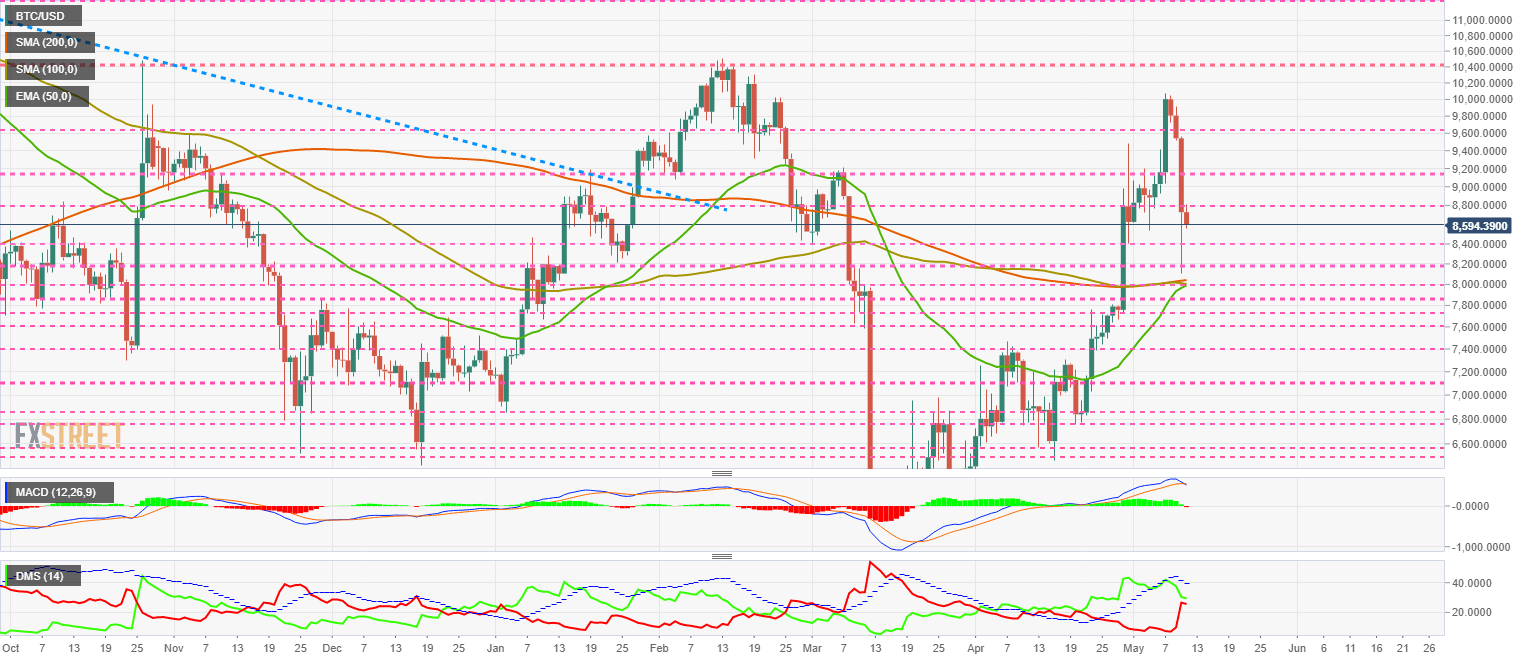
The MACD on the daily chart shows a bearish cross forming. The profile of the fast-moving average is quite sharp, which favors a possible upward rebound.
The DMI on the daily chart shows the inverse of the above-described position on the ETH/BTC pair. Here it is the bulls that are losing strength and are close to the bears, which have been very active and willing to dispute the price control of the BTC/USD pair.
ETH/USD Daily Chart
The ETH/USD pair is currently trading at the $185.8 price level after dropping to a relative low after the sell-off at $180. Ether is losing support from the 100-day simple moving average and is moving in a very technical barrier zone. The medium and long-term moving averages retain the bullish profile.
Above the current price, the first resistance level is at $190, then the second at $195 and the third one at $200.
Below the current price, the first support level is at $180, then the second at $175 and the third one at $170.
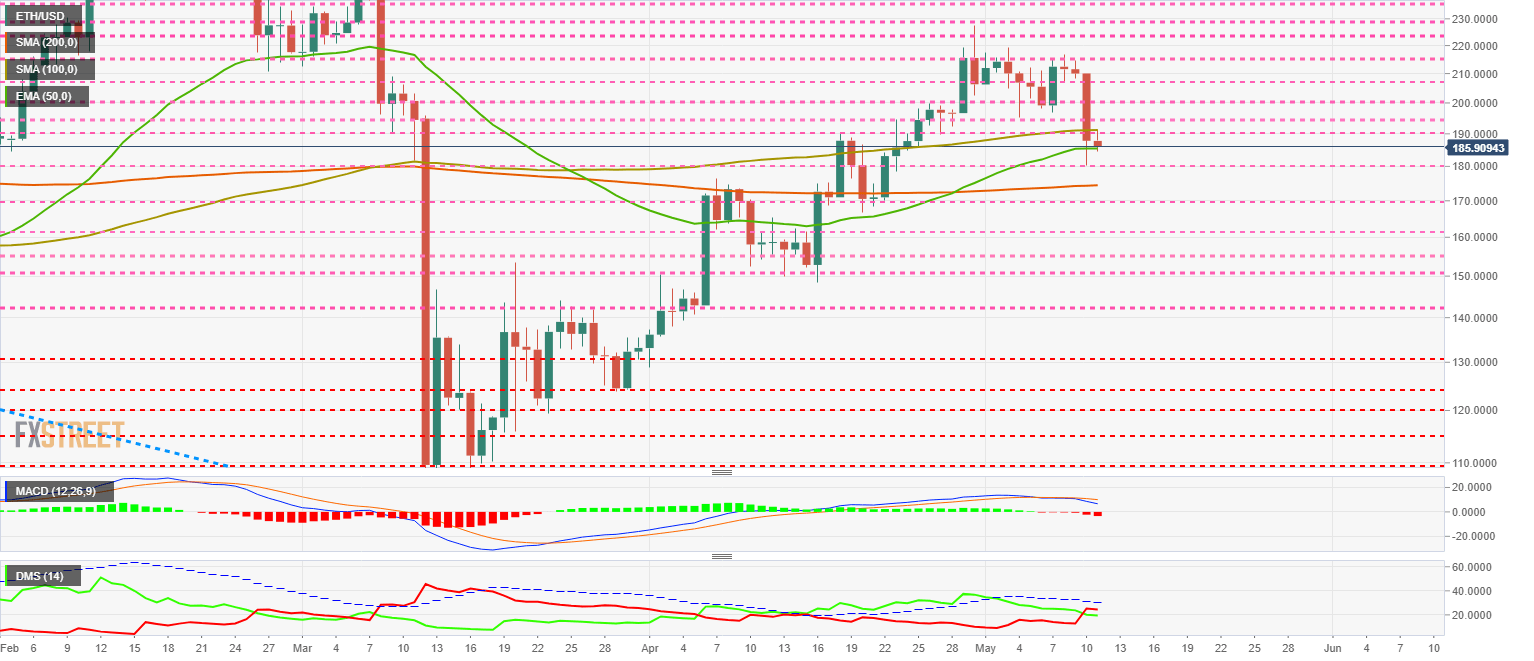
The MACD on the daily chart confirms the bearish cross and the activation of a lateral bearish pattern. Can't be ruled out a walk to the last consolidation level at $170.
The DMI on the daily chart shows the bears taking control of the ETH/USD pair, although the profile is weak for the sell-side and could lose the domain soon.
XRP/USD Daily Chart
The XRP/USD pair is currently trading at the price level of $0.1935. The impact of the Sunday sell-off has been significant on the Ripple Ltd. token. XRP is already moving below the major moving averages and enters a very fragile scenario that could push the XRP/USD price towards the $0.15 level.
Above the current price, the first resistance level is at $0.20, then the second at $0.218 and the third one at $0.237.
Below the current price, the first support level is at $0.19, then the second at $0.172 and the third one at $0.16.
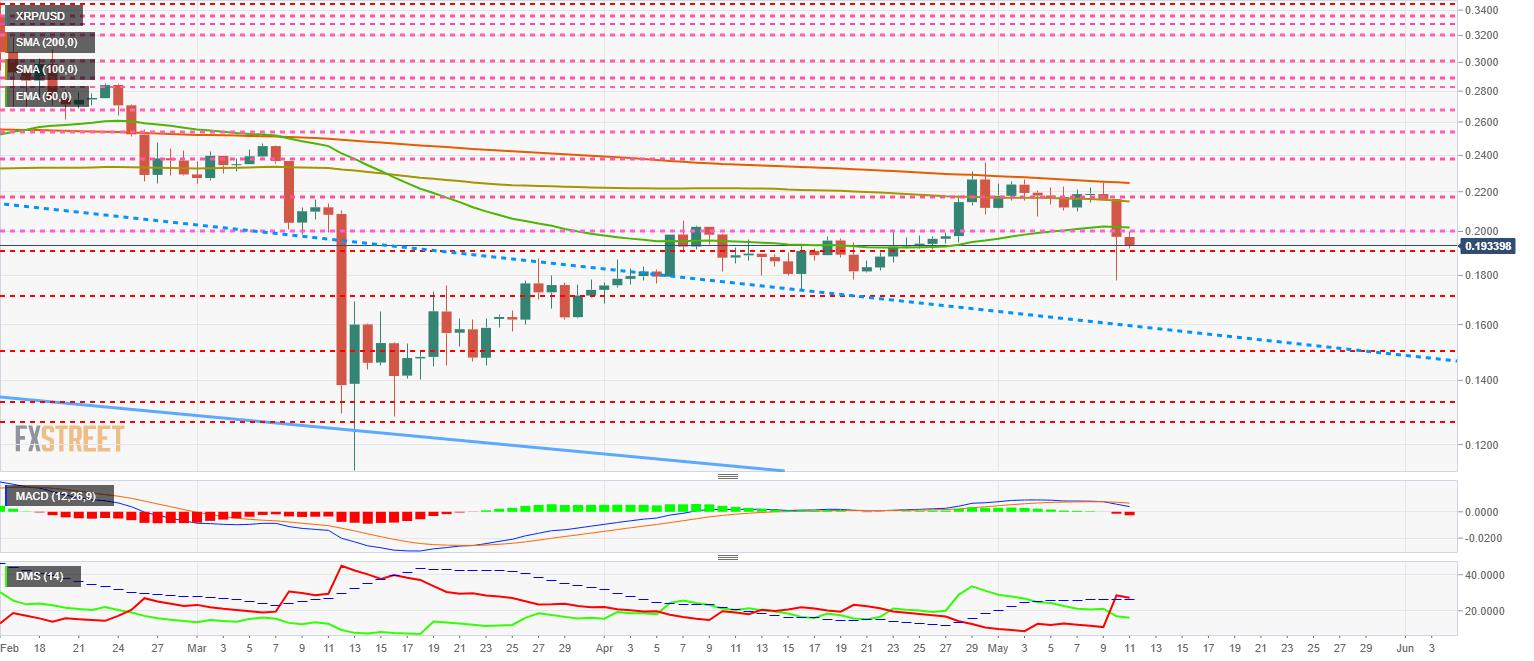
The MACD on the daily chart confirms the bearish cross and triggers a lateral bearish pattern caused by the loss of the leading moving average supports.
The DMI on the daily chart shows the bears breaking out of the bullish channel at the same time that they break out of the ADX line. The setup of this indicator triggers a bearish pattern that increases the risk of a significant price drop.
Information on these pages contains forward-looking statements that involve risks and uncertainties. Markets and instruments profiled on this page are for informational purposes only and should not in any way come across as a recommendation to buy or sell in these assets. You should do your own thorough research before making any investment decisions. FXStreet does not in any way guarantee that this information is free from mistakes, errors, or material misstatements. It also does not guarantee that this information is of a timely nature. Investing in Open Markets involves a great deal of risk, including the loss of all or a portion of your investment, as well as emotional distress. All risks, losses and costs associated with investing, including total loss of principal, are your responsibility. The views and opinions expressed in this article are those of the authors and do not necessarily reflect the official policy or position of FXStreet nor its advertisers. The author will not be held responsible for information that is found at the end of links posted on this page.
If not otherwise explicitly mentioned in the body of the article, at the time of writing, the author has no position in any stock mentioned in this article and no business relationship with any company mentioned. The author has not received compensation for writing this article, other than from FXStreet.
FXStreet and the author do not provide personalized recommendations. The author makes no representations as to the accuracy, completeness, or suitability of this information. FXStreet and the author will not be liable for any errors, omissions or any losses, injuries or damages arising from this information and its display or use. Errors and omissions excepted.
The author and FXStreet are not registered investment advisors and nothing in this article is intended to be investment advice.
Recommended Content
Editors’ Picks

Ethereum Price Forecast: ETH ETFs total net assets plummet over 60%; Justin Sun says he won't sell ETH
Ethereum traded just below $1,600 on Thursday following a 60% plunge in the total net assets of US spot Ether ETFs.

Binance Coin price nears $600 breakout as CZ reacts to BNB listing on Kraken
Binance Coin price posted considerable gains on Thursday, fuelled by investor optimism tied to its upcoming listing on the U.S.-based crypto exchange Kraken.

Binance CEO affirms company's involvement in advising countries on Bitcoin Reserve
Binance CEO Richard Teng shared in a report on Thursday that the cryptocurrency exchange has advised different governments on crypto regulations and the need to create a strategic Bitcoin reserve.

Slovenia moves to impose 25% tax on crypto traders
Slovenia has become the latest European Union member state to crack down on untaxed crypto gains, unveiling a proposal to impose a 25% tax on personal profits from digital asset disposals starting in 2026.
Bitcoin Weekly Forecast: Market uncertainty lingers, Trump’s 90-day tariff pause sparks modest recovery
Bitcoin (BTC) price extends recovery to around $82,500 on Friday after dumping to a new year-to-date low of $74,508 to start the week. Market uncertainty remains high, leading to a massive shakeout, with total liquidations hitting $2.18 billion across crypto markets.

The Best brokers to trade EUR/USD
SPONSORED Discover the top brokers for trading EUR/USD in 2025. Our list features brokers with competitive spreads, fast execution, and powerful platforms. Whether you're a beginner or an expert, find the right partner to navigate the dynamic Forex market.