Top 3 Bitcoin, Ethereum, Ripple Prediction Prices: Bitcoin points to $10450, awaiting the Halving


  • Bitcoin and Ethereum confirm terminal structures in the short term.
  • Ripple continues to show weakness, but technical details open the door to a possible rebound in the short term.
  • Stellar Lumens is facing increased resistance, with major potential gains in the mid term.

The crypto market starts the European session with generalised increases supported by the excellent performance of Bitcoin. The king of cryptocurrencies can have a run-up today to the next resistance level at $9675 in a first move and continue up to $10450 in the following hours.

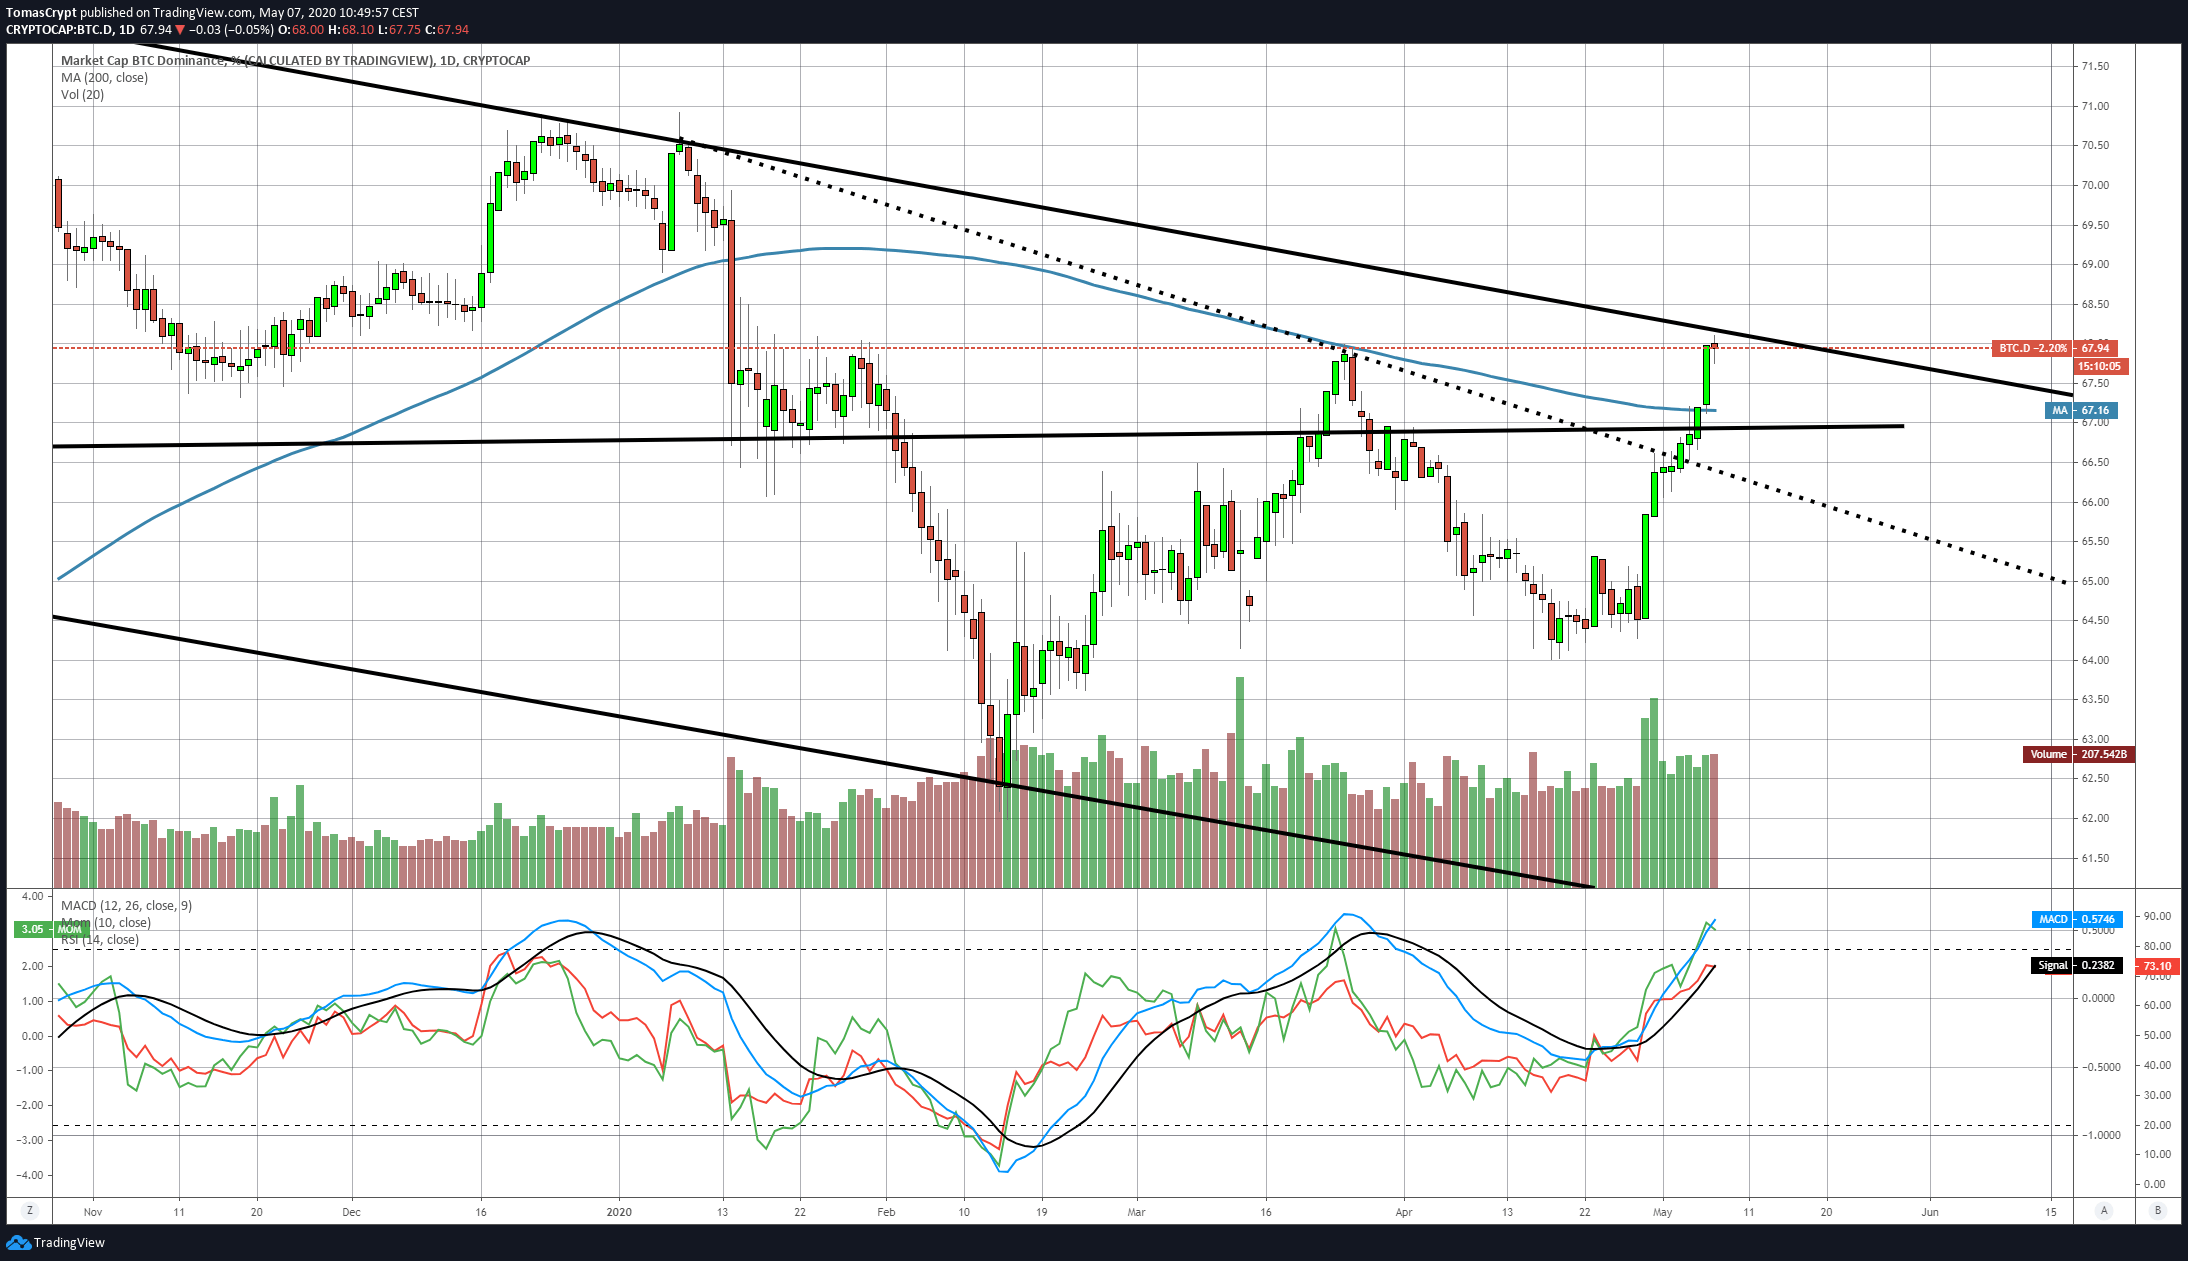
Bitcoin's strength and leadership over the rest are clear from the dominance chart, at least so far. After exceeding the 200-day moving average, the market share level moves to within a few points of the long-term bearish channel ceiling and some selling is appearing, which may indicate a capital movement towards other options on the crypto board. This capital swing does not necessarily imply a drop in the price of Bitcoin.

Stellar Lumens (XLM/USD) seems to be one of the primary beneficiaries and is rising at press time by 4.87% to $0.0726. A few cents above is the long-term downward trend line that starts at the relative highs of late 2017. 

Applying the Fibonacci retracement system, the series looks like this:

Retracement level 0.236%: $0.2391

Setback level 0.382%: $0.3713

Setback level 0.500%: $0.4781

Setback level 0.618%: $0.5849

Above these setback levels, XLM/USD valuations soar, such as in the 1.618% extension of the Fibonacci retracement system, which would give a value of $1.4899 to each Stellar token.

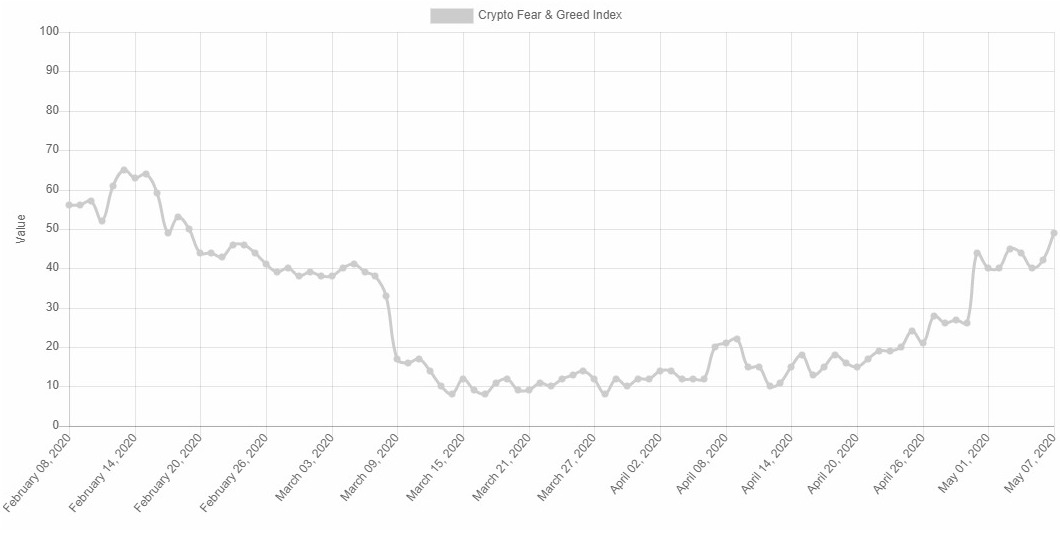
Source: alternative.me

The market sentiment level improves by one point to 49 and marks, for the first time in many months, a "Neutral" sentiment. 


ETH/BTC Daily Chart

The ETH/BTC pair is currently trading at the price level of 0.02207 and is improving for the first time after five consecutive days of declines. The presence of the 200-day simple moving average has worked well as support.  

The technical structure of the ETH/BTC pair remains weak, and it is possible a downward ride in the coming days.

Above the current price, the first resistance level is at 0.022, then the second at 0.0228 and the third one at 0.0245.

Below the current price, the first support level is at 0.0215, then the second at 0.0201 and the third one at 0.0186.

The MACD on the daily chart continues its downward trend and is now in negative territory. The gap between the moving averages is large enough for the downward movement to keep.

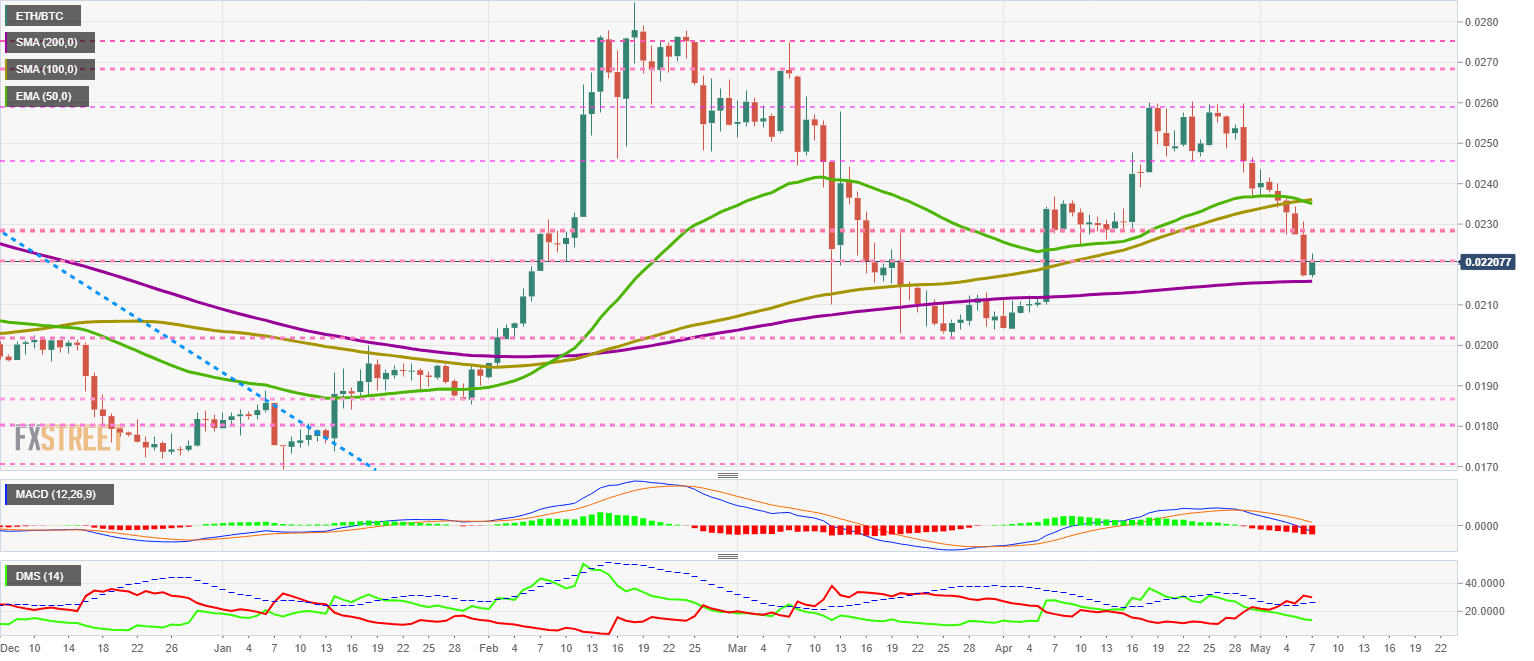
The DMI on the daily chart shows the bears losing some steam, but retaining control of the ETH/BTC pair. The bulls are not showing any interest in disputing the lead at the moment.


BTC/USD Daily Chart

The BTC/USD pair is currently trading at the price level of $9326

Above the current price, the first resistance level is at $9650, then the second at $10450 and the third one at $11300.

Below the current price, the first support level is at $9200, then the second at $8800 and the third one at $8400.

The MACD on the daily chart shows significant upside potential, although it is already in the final stages of movement after more than two months of steady gains.

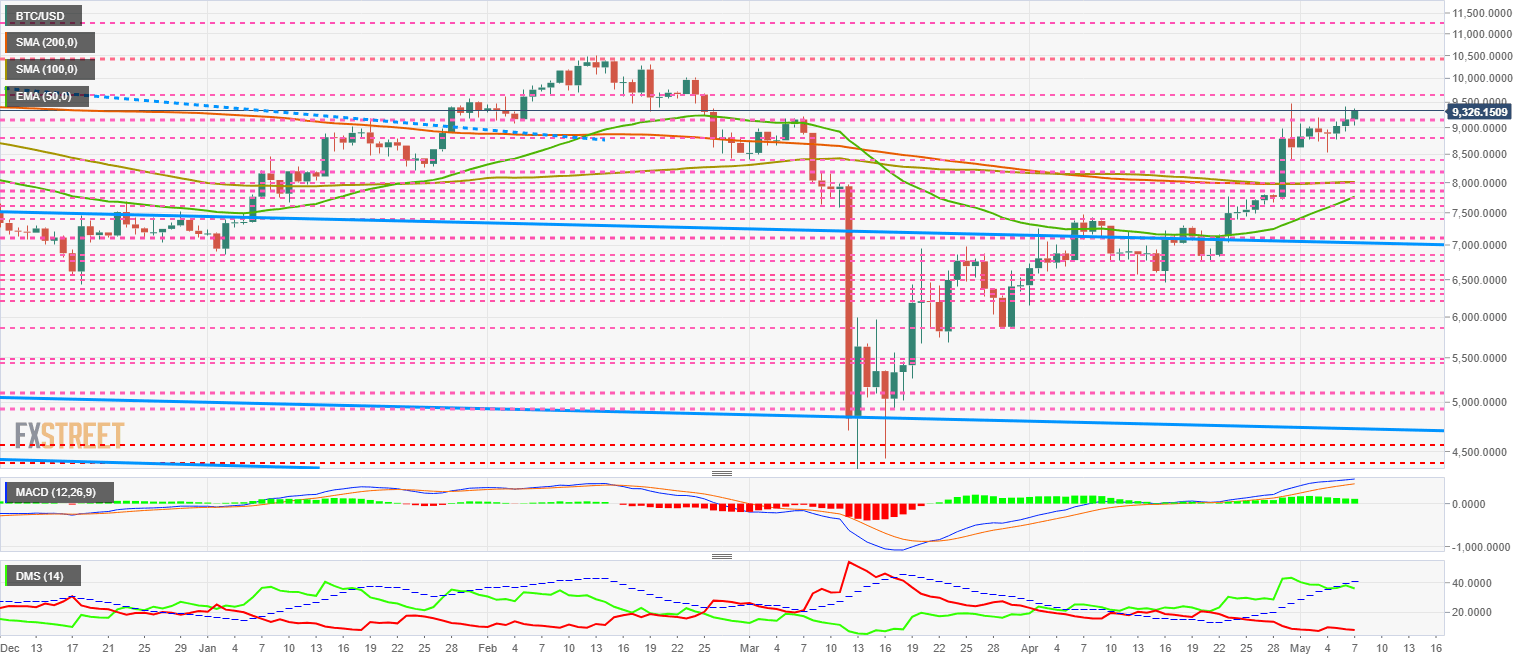
The DMI on the daily chart confirms the deactivation of the bullish pattern, which would prove a terminal pattern in the coming weeks.


ETH/USD Daily Chart

The ETH/USD pair is currently trading at $205.6 and is rising for the first time in four days.

Above the current price, the first resistance level is at $208, then the second at $216 and the third one at $225.

Below the current price, the first support level is at $200, then the second at $195 and the third one at $190.

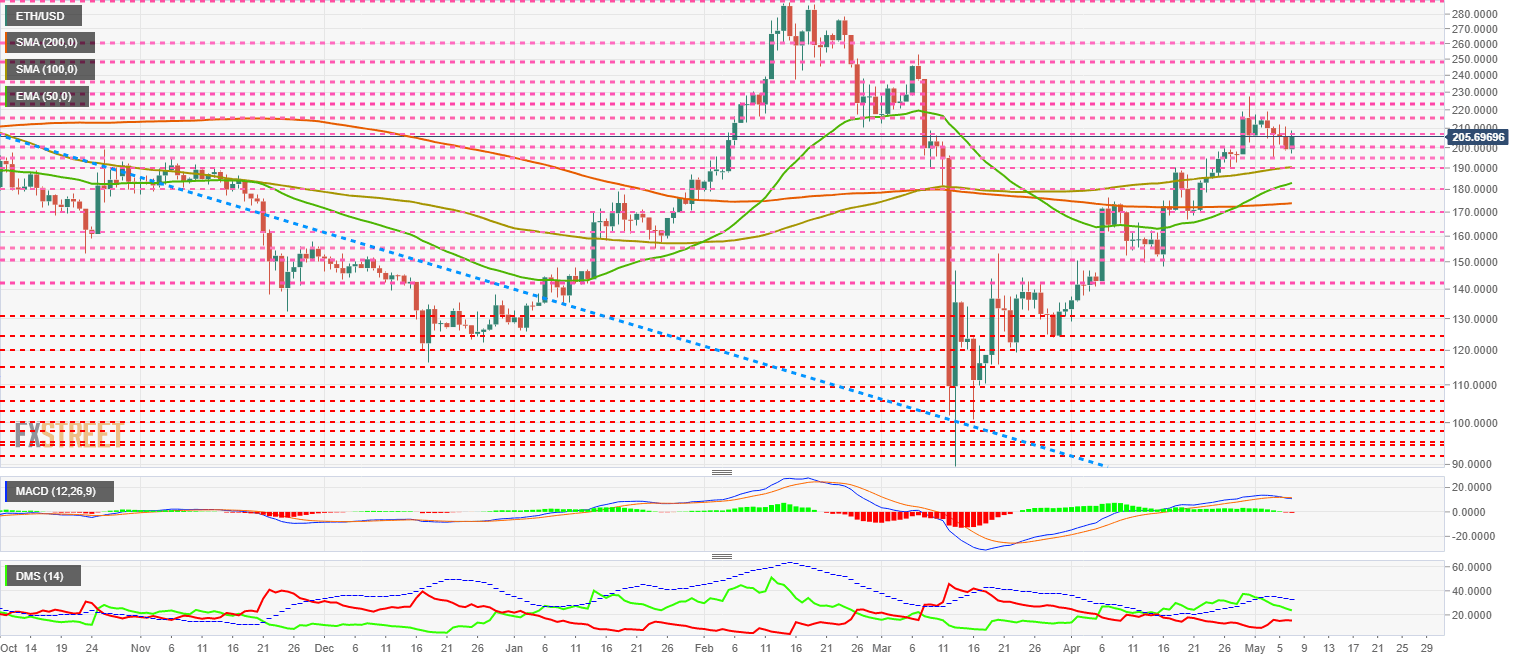
The MACD on the daily chart completes the bearish cross and confirms a later bullish scenario for the next few days.

The DMI on the daily chart shows the bulls moving downward and heading straight for a confrontation with the bears, which are rushing higher.


XRP/USD Daily Chart

The XRP/USD pair is trading at the price level of $0.216 and is unable to sustain itself above the 100-day simple moving average. Ripple shows a worrying structural weakness.

Above the current price, the first resistance level is at $0.218, then the second at $0.226 and the third one at $0.24.

Below the current price, the first support level is at $0.20, then the second at $0.191 and the third one at $0.178.

The MACD on the daily chart shows a bearish cross profile, but the slight negative slope of the fast-moving average could be indicating an imminent upward bounce.

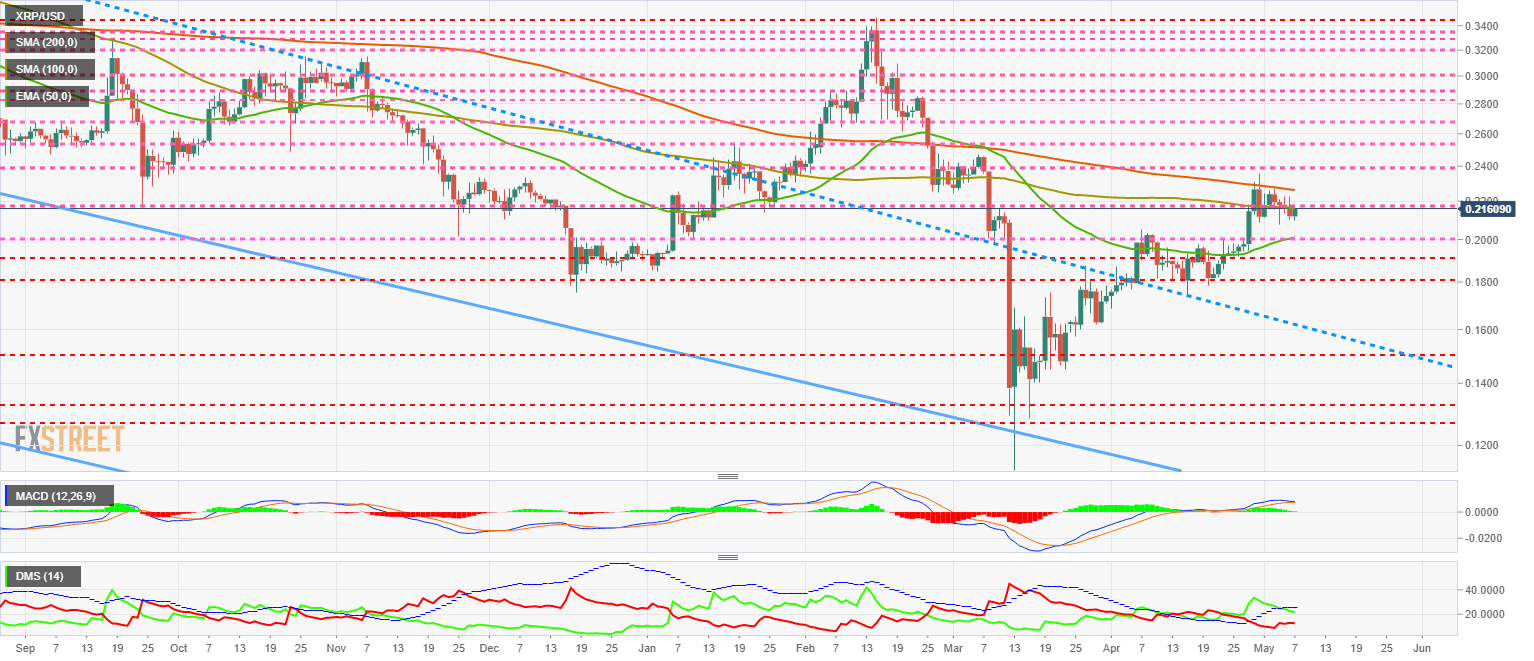
The DMI on the daily chart shows the bulls are moving downward. The bears are reacting upwards, and a collision between the two sides of the market seems inevitable within a few days.


Information on these pages contains forward-looking statements that involve risks and uncertainties. Markets and instruments profiled on this page are for informational purposes only and should not in any way come across as a recommendation to buy or sell in these assets. You should do your own thorough research before making any investment decisions. FXStreet does not in any way guarantee that this information is free from mistakes, errors, or material misstatements. It also does not guarantee that this information is of a timely nature. Investing in Open Markets involves a great deal of risk, including the loss of all or a portion of your investment, as well as emotional distress. All risks, losses and costs associated with investing, including total loss of principal, are your responsibility. The views and opinions expressed in this article are those of the authors and do not necessarily reflect the official policy or position of FXStreet nor its advertisers. The author will not be held responsible for information that is found at the end of links posted on this page.

If not otherwise explicitly mentioned in the body of the article, at the time of writing, the author has no position in any stock mentioned in this article and no business relationship with any company mentioned. The author has not received compensation for writing this article, other than from FXStreet.

FXStreet and the author do not provide personalized recommendations. The author makes no representations as to the accuracy, completeness, or suitability of this information. FXStreet and the author will not be liable for any errors, omissions or any losses, injuries or damages arising from this information and its display or use. Errors and omissions excepted.

The author and FXStreet are not registered investment advisors and nothing in this article is intended to be investment advice.

Recommended content


Recommended Content

Editors’ Picks

Crypto today: Bitcoin, Ethereum, XRP tests key support, TRON network non-stablecoin activity hits new highs

Crypto today: Bitcoin, Ethereum, XRP tests key support, TRON network non-stablecoin activity hits new highs

Bitcoin, Ethereum, and XRP hover around key support levels after registering a steep correction earlier this week. TRON network’s stablecoin activity hit new highs following the release of SunPump. TRON trades at around $0.1500, almost flat on the day.

More Cryptocurrencies News
Bitcoin Weekly Forecast: $50,000 on the horizon if it breaks below key support level

Bitcoin Weekly Forecast: $50,000 on the horizon if it breaks below key support level

Bitcoin price tests the key support level at $56,000 on Friday, consolidating over a 1% decline this week. If it drops below this support, a continued downtrend is likely for BTC, as suggested by substantial outflows from US spot Bitcoin ETFs, rising institutional selling, and bearish on-chain indicators.

More Bitcoin News
Vitalik Buterin says all Layer-2 token holdings will be donated to charity, won’t sell for profit

Vitalik Buterin says all Layer-2 token holdings will be donated to charity, won’t sell for profit

Vitalik Buterin, Ethereum co-founder, has not sold Ether since the altcoin’s ICO in 2018. On-chain transfers by Buterin make headlines as ETH holders keep eyes peeled for selling pressure on the altcoin. 

More Ethereum News
WazirX, PenPie and Bo Shen hackers launder $42.7 million in stolen funds through Tornado Cash

WazirX, PenPie and Bo Shen hackers launder $42.7 million in stolen funds through Tornado Cash

Three different hackers responsible for the exploit of crypto assets worth millions of dollars from crypto exchange WazirX, DeFi protocol Penpie, and Founder of Fenbushi Capital Bo Shen are using Tornado Cash to move part of the stolen funds.

More Cryptocurrencies News
Bitcoin: $50,000 on the horizon if it breaks below key support level

Bitcoin: $50,000 on the horizon if it breaks below key support level

Bitcoin (BTC) price tests the key support level at $56,000 on Friday, consolidating over a 1% decline this week. If it drops below this support, a continued downtrend is likely for BTC, as suggested by substantial outflows from US spot Bitcoin ETFs, rising institutional selling, and bearish on-chain indicators.

Read full analysis
Moneta Markets review 2024: All you need to know

Moneta Markets review 2024: All you need to know

VERIFIED In this review, the FXStreet team provides an independent and thorough analysis based on direct testing and real experiences with Moneta Markets – an excellent broker for novice to intermediate forex traders who want to broaden their knowledge base.

Read More

BTC

ETH

XRP