Top 3 Bitcoin, Ethereum, Ripple Prediction Prices: Bitcoin leads the dominance war – Ripple knocked out
- Bitcoin's strong upward move shatters Ripple and drives Ethereum into key supports.
- Halving's proximity is the spotlight, as will the launch of Ethereum 2.0 later.
- Ripple Ltd has a problem with XRP, or is XRP in trouble with its developers?

War for market dominance in crypto lived one of the fiercest battles in memory on Thursday.
The campaign chronicle reveals a winner, Bitcoin, and a clear loser, Ripple. Ethereum entrenched itself at the last minute over the 200-period simple average and will have its chance to launch a reconquest campaign against King Bitcoin.
Leaving aside the words of war, the aftermath of yesterday's capital movements sends a clear and forceful message to the Crypto market.
- Bitcoin is the dominant asset, and when there is an influx of new money, the choice is clear.
- The Ethereum is the Altcoins' leader, and its level of market dominance is as far from that of Bitcoin as the rest of Altcoins. A solitary prince.
- Ripple's knocked out. The XRP dominance chart in the weekly range shows a dangerous downward trend accompanied by extraordinary sales volume during the last four weeks.
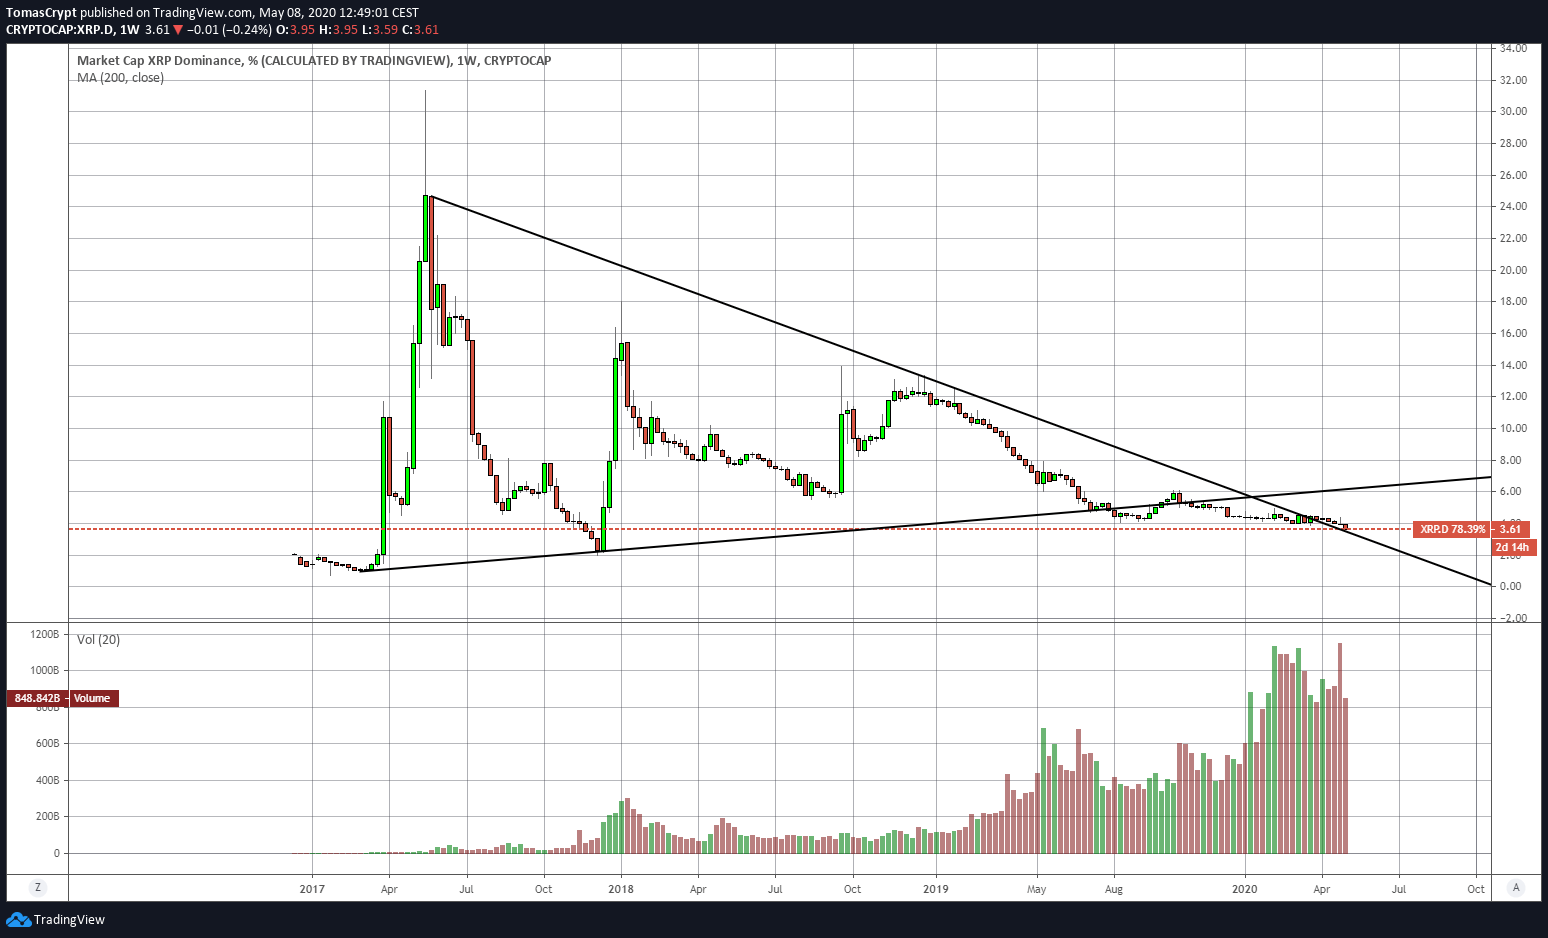
If there is one thing that experienced stock traders know, it is to buy cheap, and it is easy to expect the price to be lower at the worst moment of the XRP within the crypto ecosystem, not later on converted into a stake in Ripple Ltd.
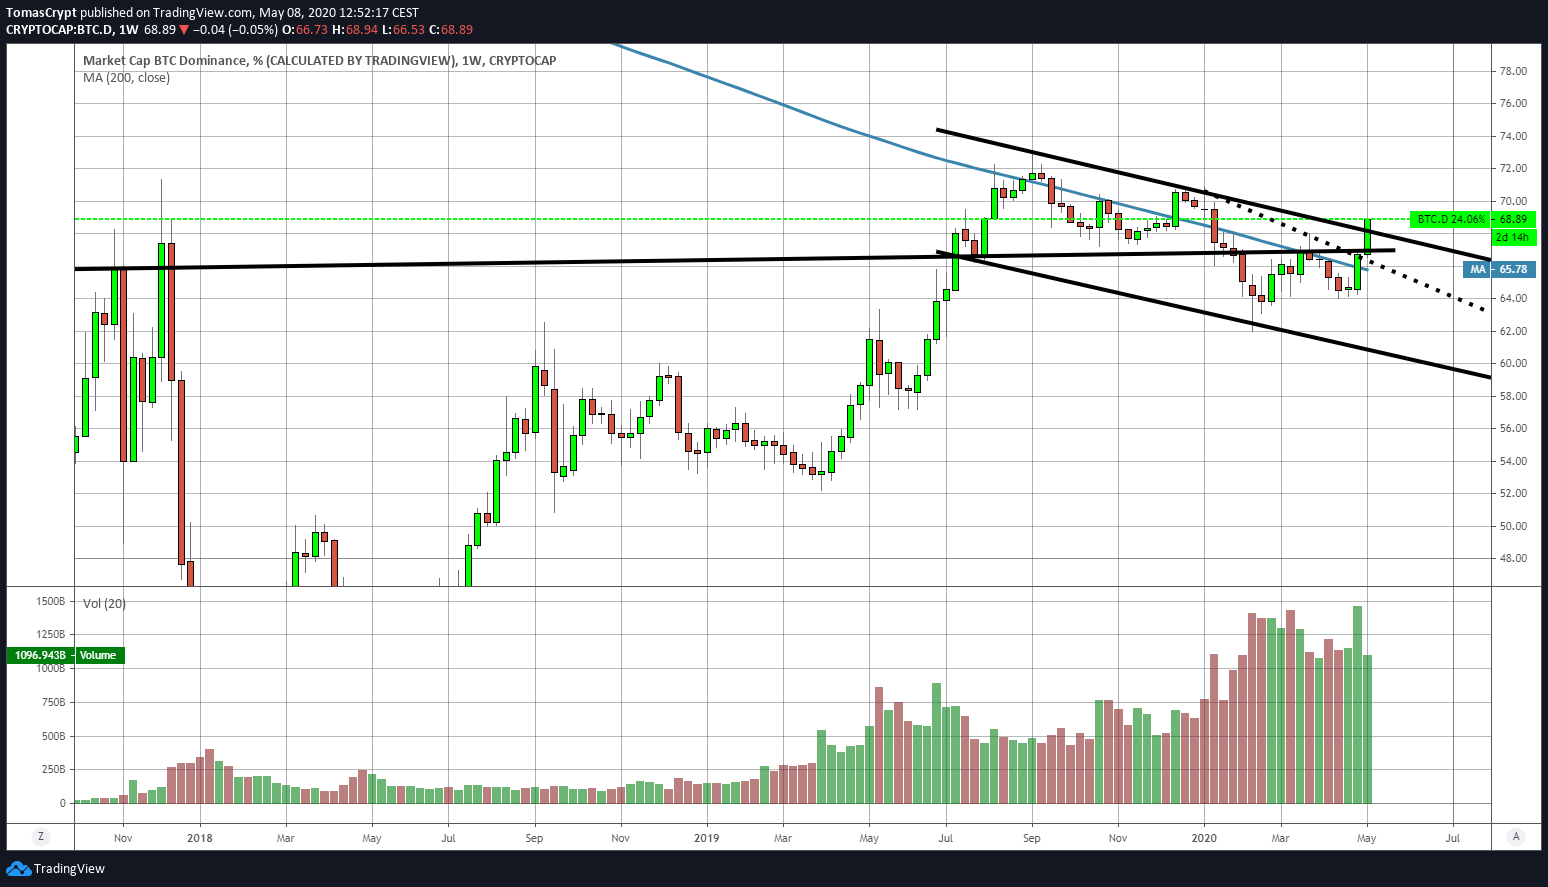
The Bitcoin dominance weekly chart shows the upward breach of the long-term downward trend line and opens up a new, strongly bullish scenario for Bitcoin's aspirations.
The Fear&Greed Index reaches today the 55 levels and improves more than 300% from the April lows.
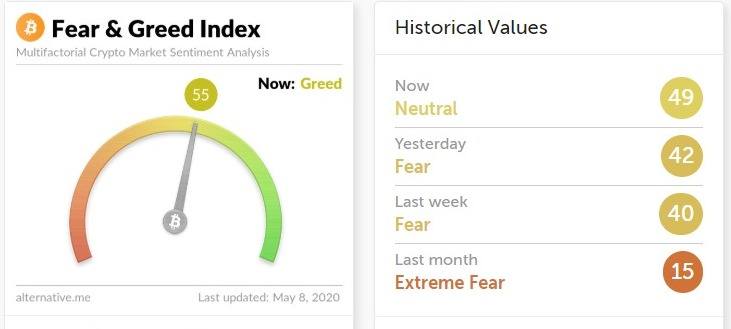
Source: alternative.me
Despite the incredible improvement, the market sentiment indicator is still far from showing worrying levels of optimism.
ETH/BTC Daily Chart
The ETH/BTC pair is currently trading at the price level of 0.02120 and seems to be repeating the chart pattern we saw earlier this year just before the first bullish leg of the year.
The current price is below the 200-day simple moving average, a dismal figure that the ETH/BTC must correct soon to avoid further damage.
Above the current price, the first resistance level is at 0.0215, then the second at 0.022 and the third one at 0.0225.
Below the current price, the first support level is at 0.020, then the second at 0.0188 and the third one at 0.018.

The DMI on the daily chart shows bears losing strength, a significant behaviour as the current situation should tend to increase the bearish momentum. The bulls are improving slightly, but are not showing a change in direction at the moment.
BTC/USD Daily Chart
The BTC/USD pair is the big winner of yesterday's trading session. The proximity of the halving event is capitalizing on the leading cryptocurrency with a definite impact on the price. On Friday, BTC/USD is falling slightly, looking to confirm support at the $9600 price congestion level.
The halving event will happen on May 11 or 12, and the price information from that point onwards may mark the future development in the medium and long term.
Above the current price, the first resistance level is at $10400, then the second at $11250 and the third one at $14000.
Below the current price, the first support level is at $9600, then the second at $9200 and the third one at $8800.
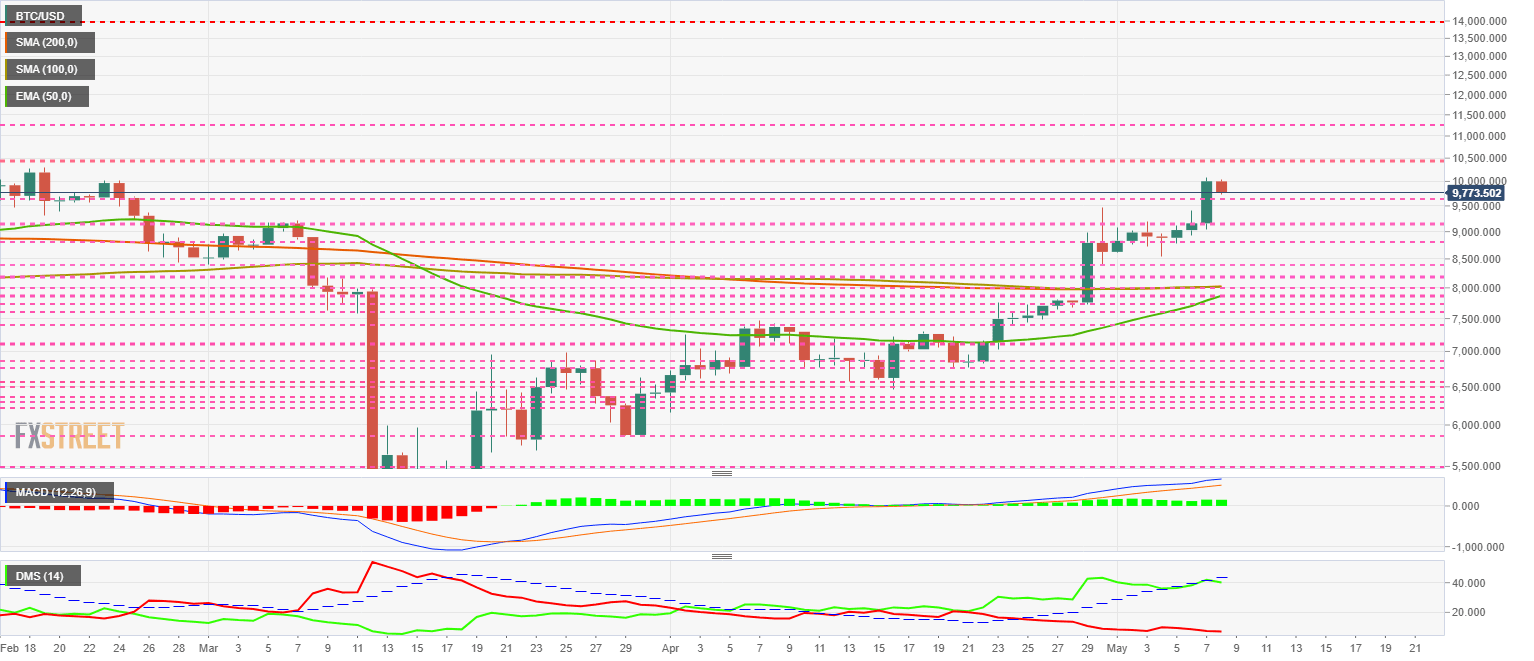
The DMI on the daily chart shows bulls losing support from the ADX line, which deactivates the classic bullish pattern and activates a lateral bullish one with increased volatility.
ETH/USD Daily Chart
The ETH/USD pair is trading at this time at the price level of $211.7 and remains stuck below the price congestion resistance level of $215.
A depletion scenario in the BTC/USD can trigger a bullish behavior for Ether. Once the Bitcoin halving event passes, attention will turn to the release of version 2.0 of the Ethereum network.
Above the current price, the first resistance level is at $215, then the second at $225 and the third one at $230.
Below the current price, the first support level is at $205, then the second at $200 and the third one at $195.
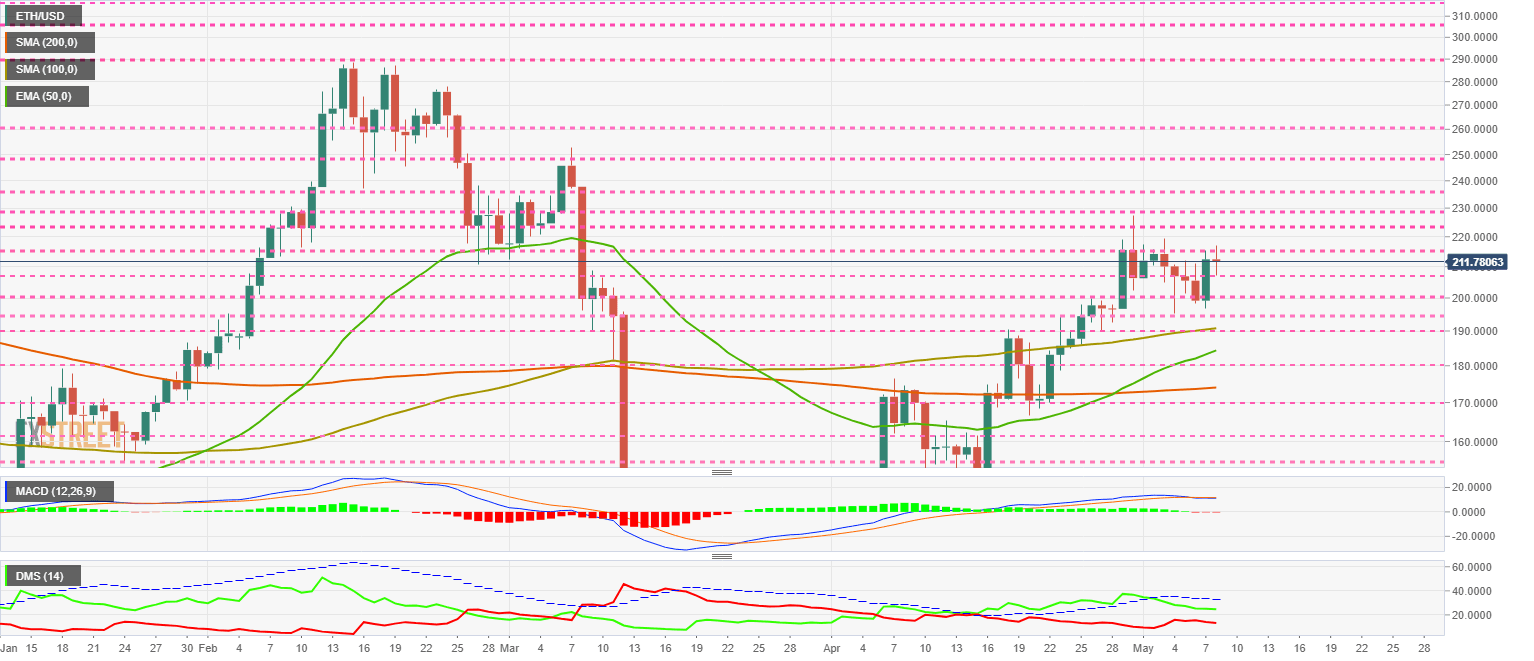
The DMI on the daily chart shows the bulls again moving a little higher, while the bears also retreat a little.
XRP/USD Daily Chart
The XRP/USD pair is currently trading at the price level of $0.217. The price of the XRP does not negatively capitalize on yesterday's dominance loss. But it will reflect this.
Above the current price, the first resistance level is at $0.22, then the second at $0.225 and the third one at $0.237.
Below the current price, the first support level is at $0.20, then the second at $0.19 and the third one at $0.18.
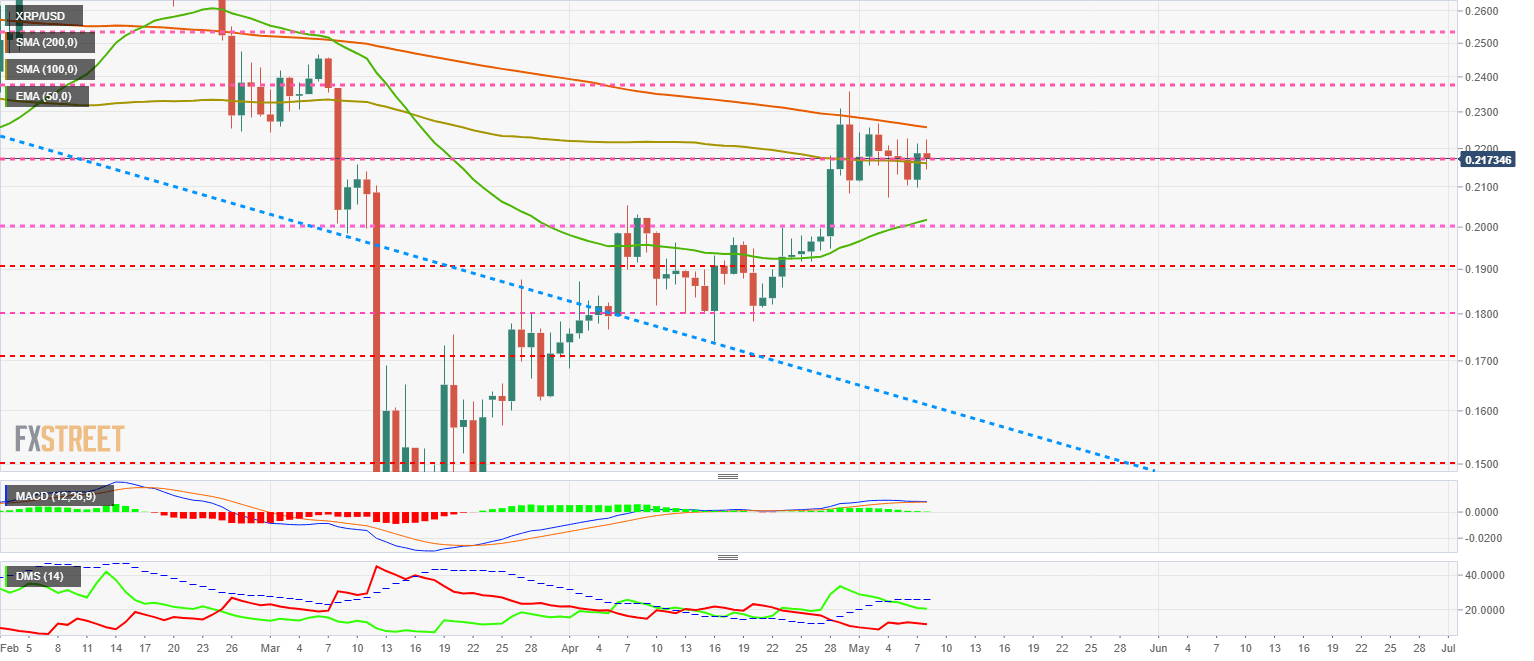
The DMI on the daily chart shows the bulls into a downward trend. The bullish side avoids the disaster because the bears are not yet showing any intention of competing for the lead. The current structure leaves room for a possible upward rebound.
Author

Tomas Salles
FXStreet
Tomàs Sallés was born in Barcelona in 1972, he is a certified technical analyst after having completing specialized courses in Spain and Switzerland.


