|

Token PENDLE looking for reaction from blue box area

PENDLE is a DeFi protocol focused on yield trading, allowing users to both fix or leverage their yield. In today’s blog, we’ll explain the daily Elliott Wave structure taking place and show the potential outcome for the token.

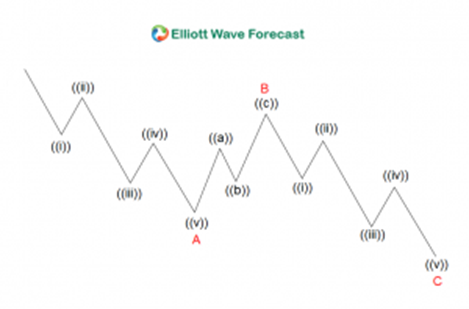
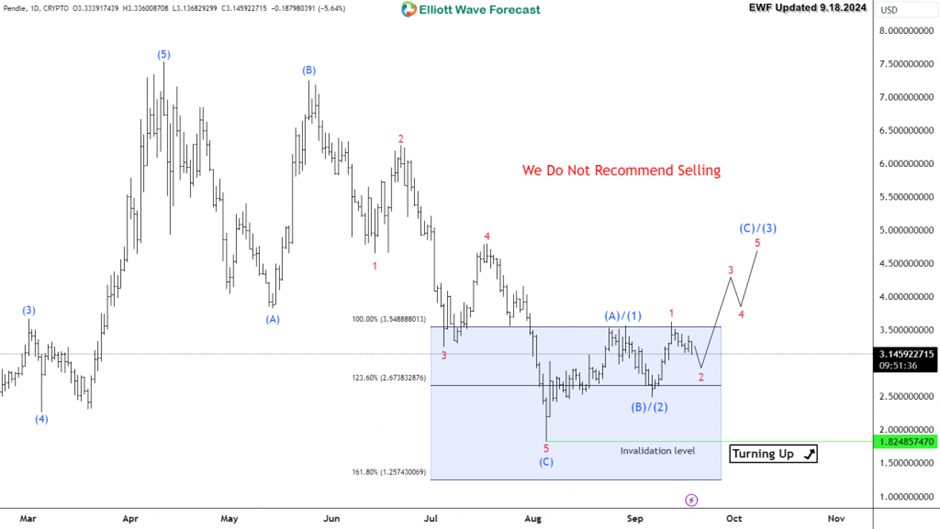
Since April 2024, PENDLE started its correction to the downside and it lost 75% of its value. The move from the peak unfolded within a 3 waves ZigZag structure. This Elliott Wave corrective structure results on a reversal to take place. The token reached the equal legs area at $3.5 – $1.25 from where it ended the daily move to the downside.

The blue box showing in our chart is a technical area where we expect PENDLE to find Buyers and react higher. Up from there, it’s expected to turn to the upside either to start a new 5 waves advance or at least bounce in 3 waves from there.

Elliott Wave zigzag structure

fxsoriginal

PENDLE daily chart 9.18.2024

Chart

Author

Elliott Wave Forecast Team

Elliott Wave Forecast Team

ElliottWave-Forecast.com

More from Elliott Wave Forecast Team
Share:

Editor's Picks

XRP sell-off deepens amid weak retail interest, risk-off sentiment

Ripple (XRP) is edging lower around $1.36 at the time of writing on Wednesday, weighed down by low retail interest and macroeconomic uncertainty, which is accelerating risk-off sentiment.

Crypto Today: Bitcoin, Ethereum, XRP extend sell-off amid negative funding rates 

Bitcoin is down 15% in February and looks poised to extend its losses toward the yearly low of $60,000. Ethereum and Ripple are following in Bitcoin's footsteps, weighed down by a weak derivatives market. 

Hyperliquid tests key support as sell-side pressure intensifies

Hyerliquid (HYPE) drops to its 50-day Exponential Moving Average (EMA) at $28.85 at the time of writing on Wednesday, extending a decline of roughly 10% so far this week. 

Stellar Price Forecast: XLM risks revisiting $0.136 as sell-off continues

Stellar is trading below $0.160 at the time of writing on Wednesday, extending its correction for the fifth consecutive day. The bearish price action is further supported by rising short bets and declining Open Interest in the derivatives market. 

Bitcoin Price Annual Forecast: BTC holds long-term bullish structure heading into 2026

Bitcoin (BTC) is wrapping up 2025 as one of its most eventful years, defined by unprecedented institutional participation, major regulatory developments, and extreme price volatility.

Bitcoin: The worst may be behind us

Bitcoin (BTC) price recovers slightly, trading at $65,000 at the time of writing on Friday, after reaching a low of $60,000 during the early Asian trading session. The Crypto King remained under pressure so far this week, posting three consecutive weeks of losses exceeding 30%.