Three technical reasons why Bitcoin price is bound for a steep correction
- Bitcoin price defended a crucial support level at $30,000 and currently trades at $38,000.
- However, after a significant rally in the past week, the flagship cryptocurrency might be poised for a correction.
- There are several indicators showing Bitcoin price can slip towards $34,000.

Bitcoin’s market dominance has experienced a steep decline in the past week going from 65% to only 60.8% while many altcoins are pumping quite hard. Nonetheless, Bitcoin price has recovered from its low point of $28,850 and it’s extremely close to $40,000.
Bitcoin price needs to retrace first before another leg up
On the daily chart, the TD Sequential indicator has presented a sell signal for the first time since January 10. On top of that, the parabolic SAR remains bearish just like the SuperTrend indicator, adding a lot of credence to a bearish breakdown.
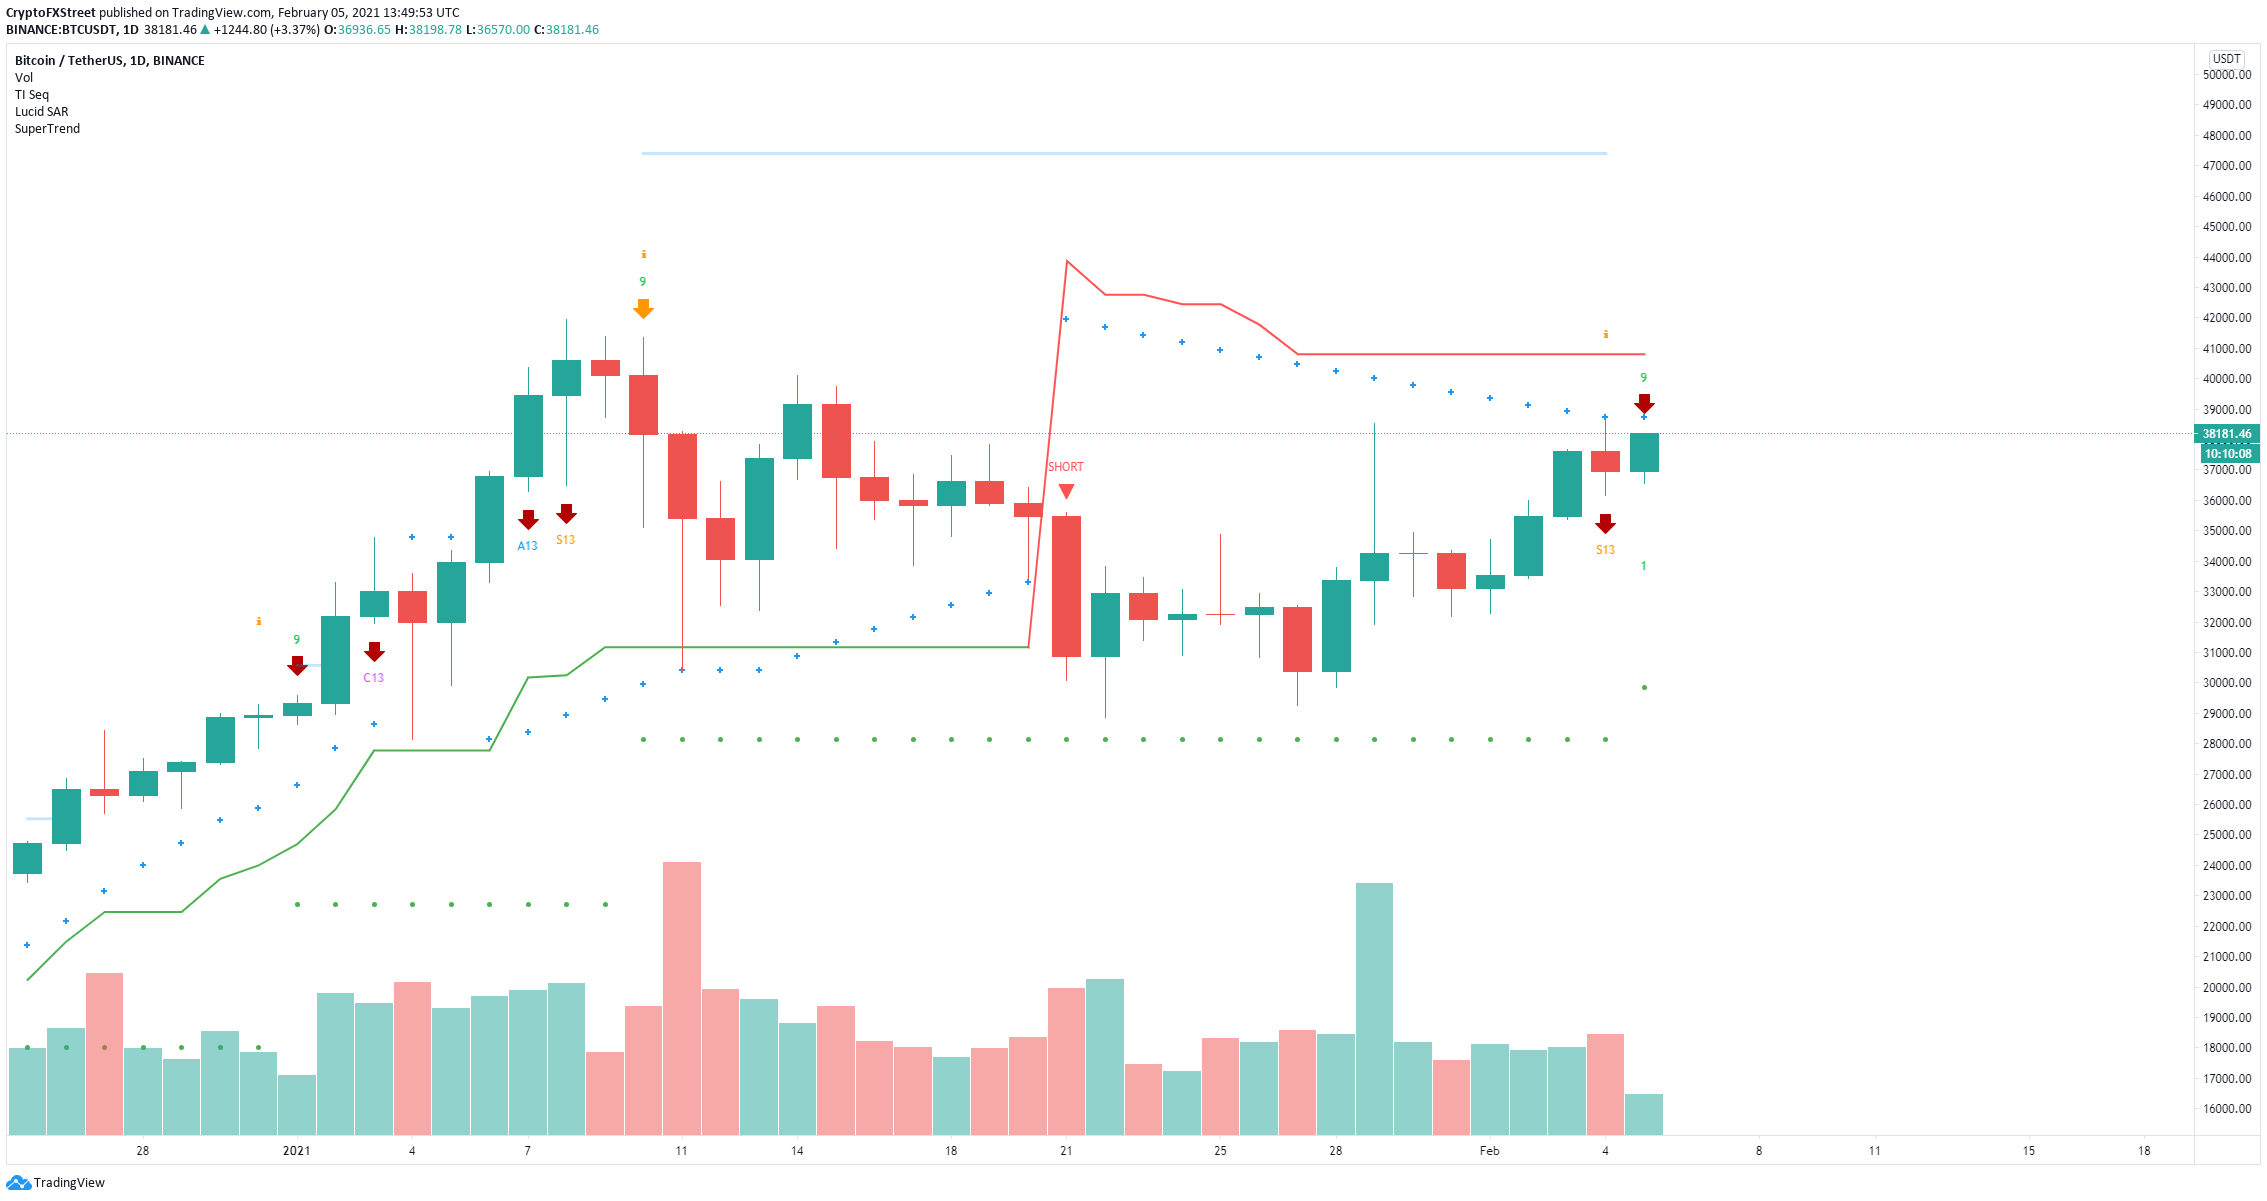
BTC/USD daily chart
The current price of Bitcoin is hovering around the upper Bollinger band. A rejection from this point can push Bitcoin price down to the middle band at $34,000. Failure to hold this level can put investors into panic mode and drive BTC down to the 100-SMA at $32,000 and even slice through it down to $30,000.
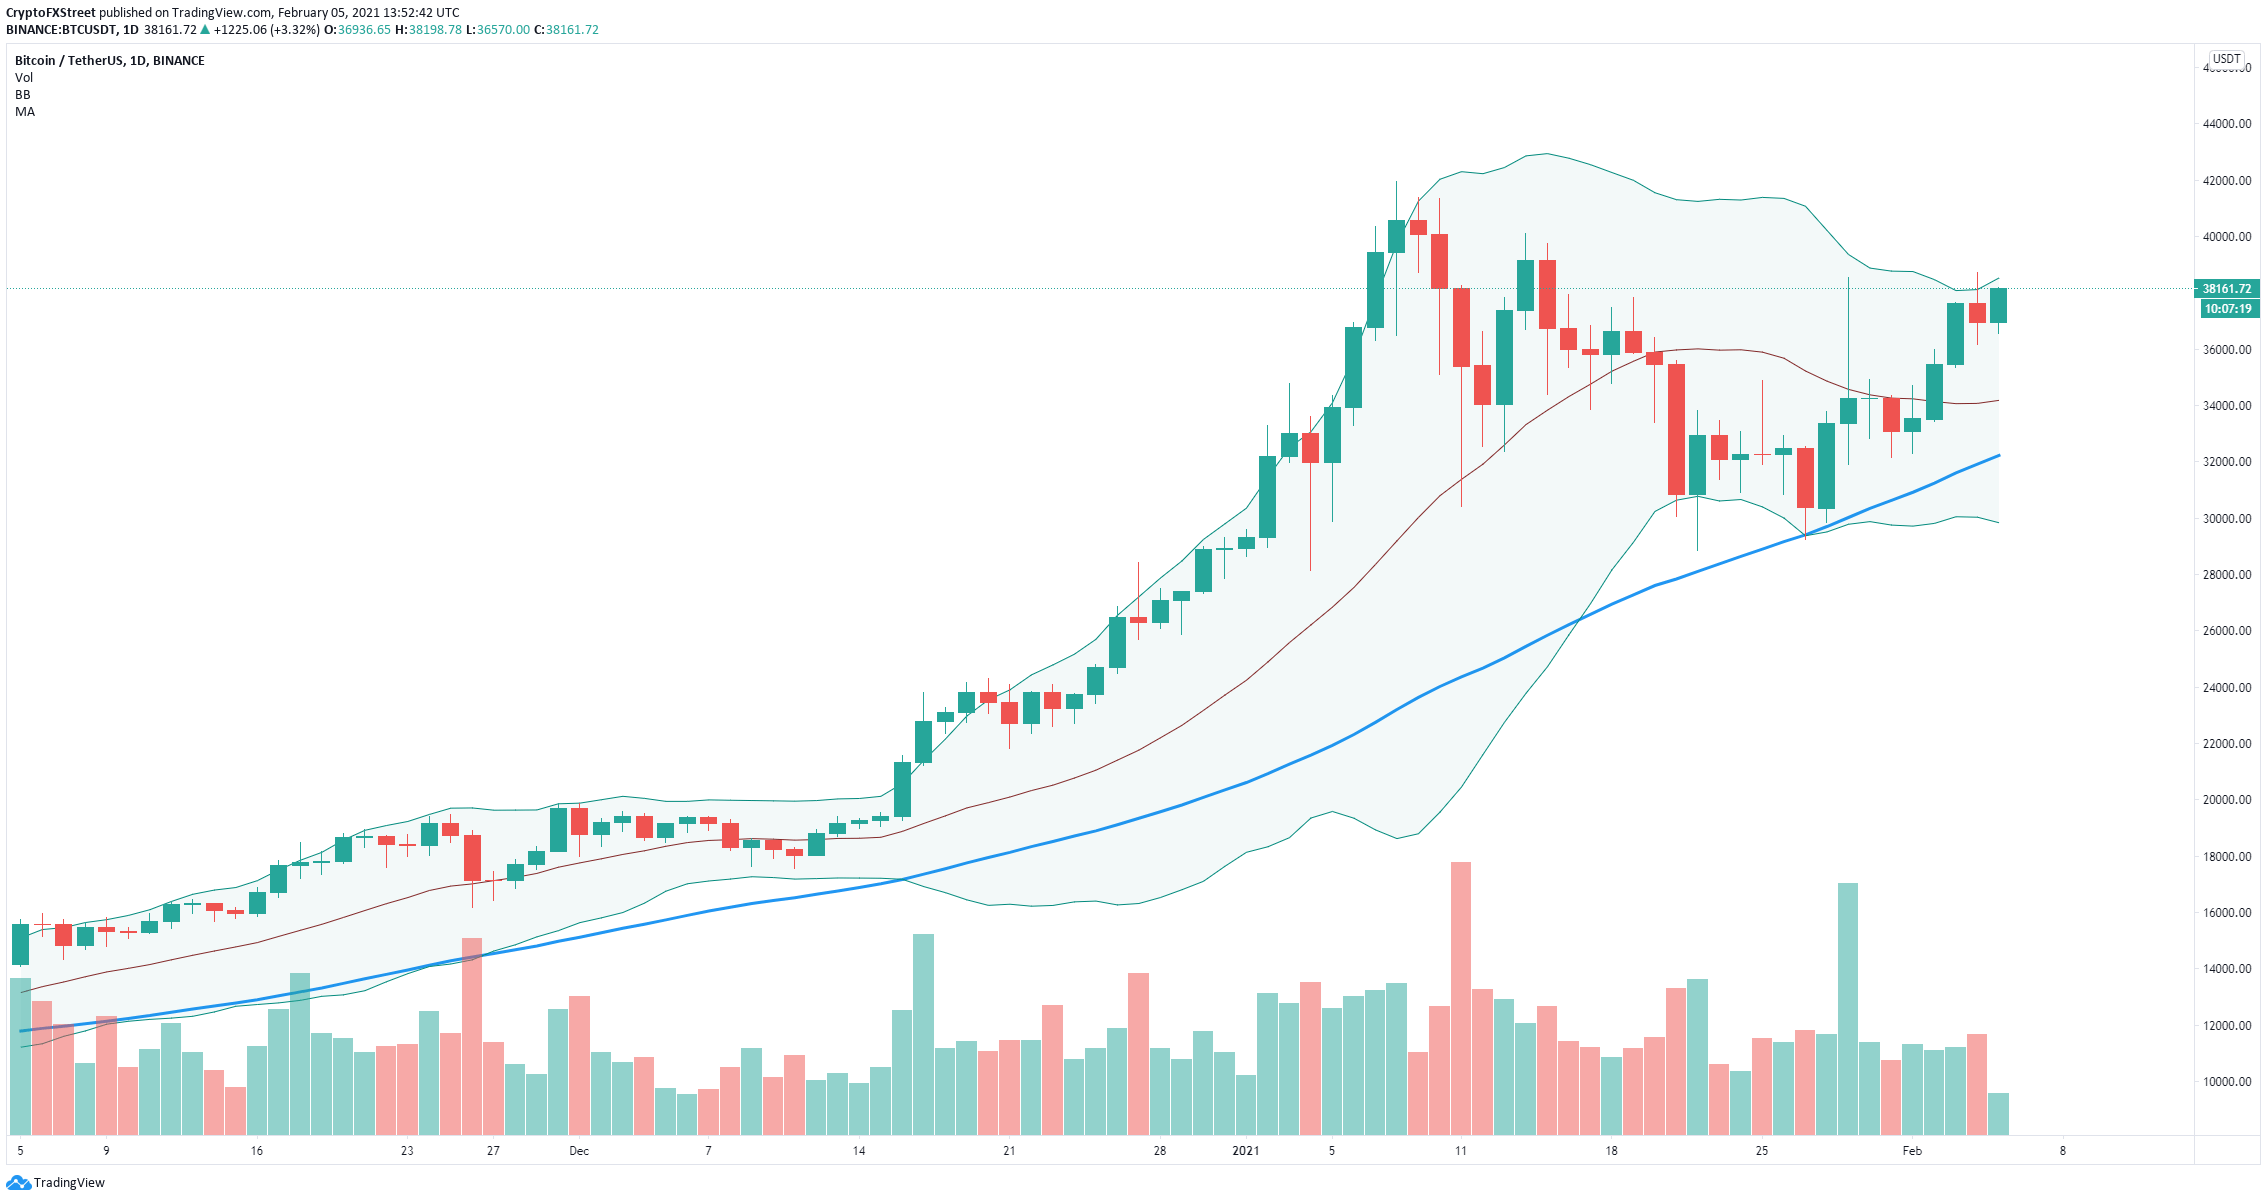
BTC/USD daily chart
However, despite several indicators in favor of the bears, a breakout above the upper Bollinger band at $38,400 would invalidate the bearish outlook and push Bitcoin price towards $40,000.
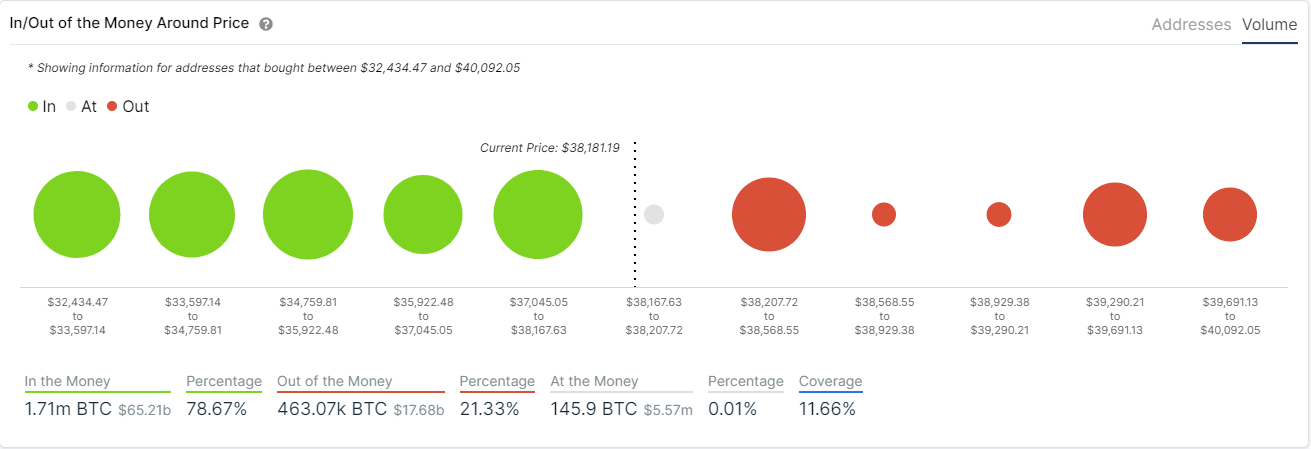
BTC IOMAP chart
The In/Out of the Money Around Price (IOMAP) model indicates that Bitcoin has a ton of support below $38,000 until $32,000. On the other hand, there is only one crucial barrier between $38,200 and $38,500 which coincides with the upper Bollinger band. The IOMAP model adds credence to the bullish outlook as a breakout above this barrier will drive Bitcoin price to $40,000.
Author

Lorenzo Stroe
Independent Analyst
Lorenzo is an experienced Technical Analyst and Content Writer who has been working in the cryptocurrency industry since 2012. He also has a passion for trading.


