![]() Cointelegraph Team
Cointelegraph Team
Cointelegraph
The price of Quant Network (QNT) eyes a sharp reversal after an impressive 450% rally in the past four months.
QNT’s downside outlook takes cues from a flurry of technical and on-chain indicators, all suggesting that investors who backed its price rally have likely reached the point of exhaustion.
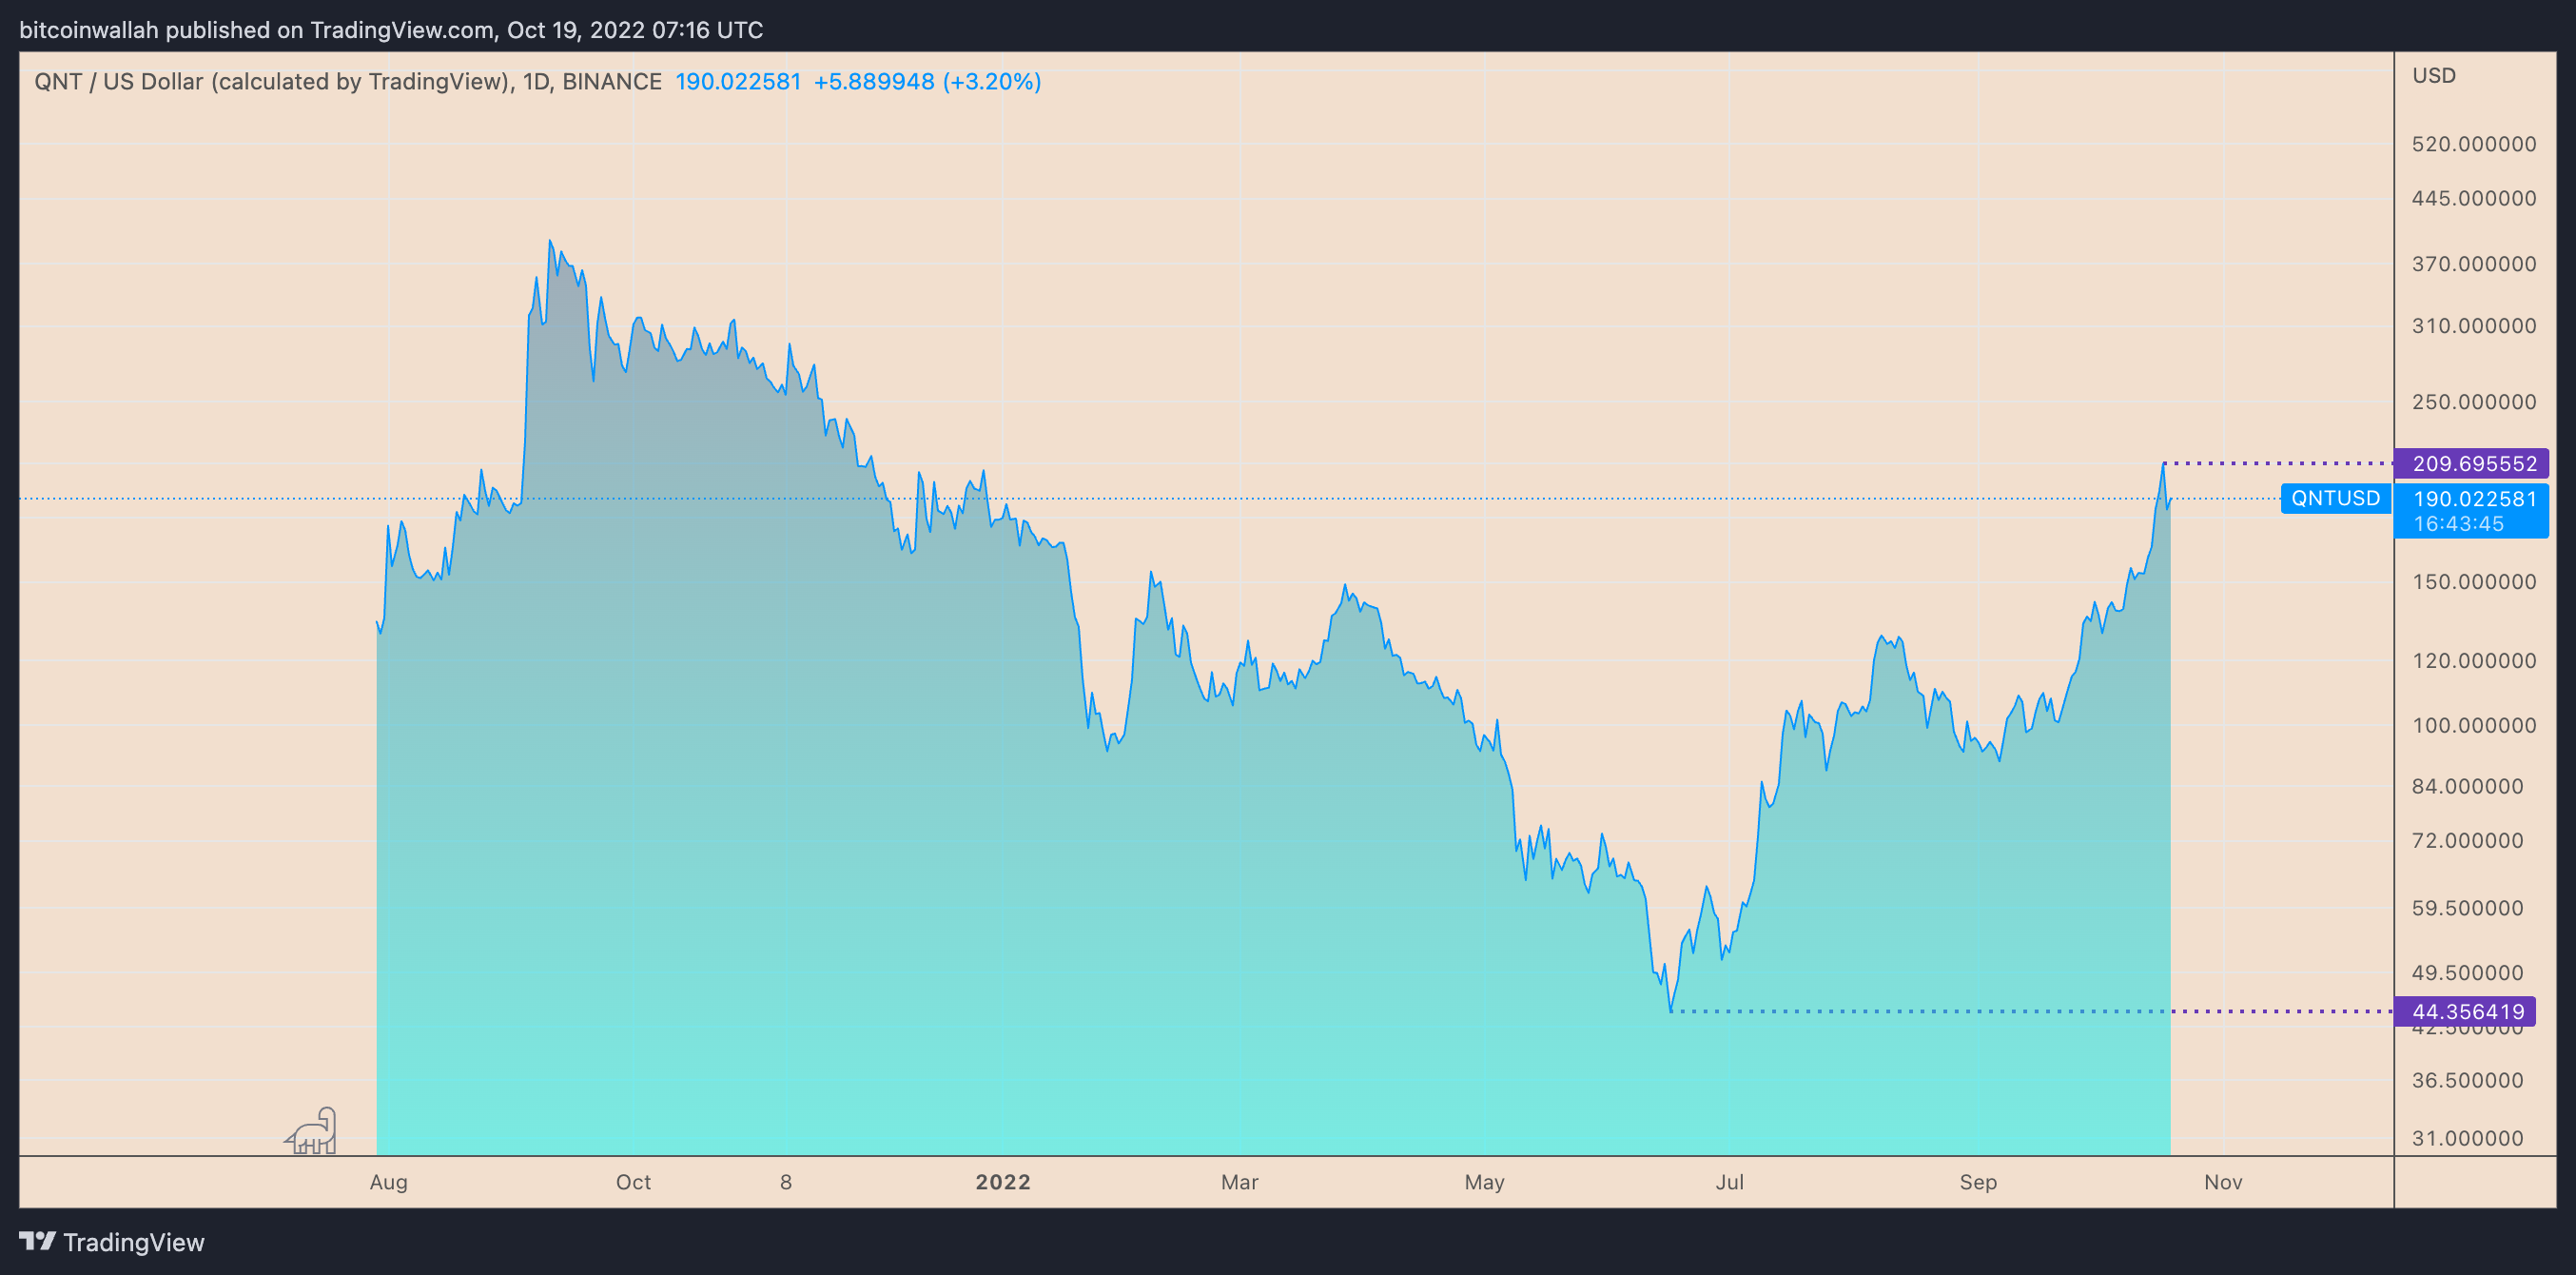
QNT/USD daily price chart. Source: TradingView
Here are three reasons why it could be happening.
Quant's daily active addresses drop
Interestingly, the period of QNT’s massive uptrend coincided with similar upticks in its number of daily active addresses (DAA). This metric represents the number of unique addresses active on the network as a sender or receiver.
As of Oct. 17, the Quant Network’s DAA reached an all-time high of 10,949, up from around 5,850 four months ago, data from Santiment shows. Its upsurge during the QNT price uptrend shows traders were net buyers.
However, the DAA readings dropped sharply in the past two days, reaching nearly 6,800 on Oct. 19. Simultaneously, QNT’s price fell by 25.5% to $171 in the same period, suggesting that many traders have been securing their profits.
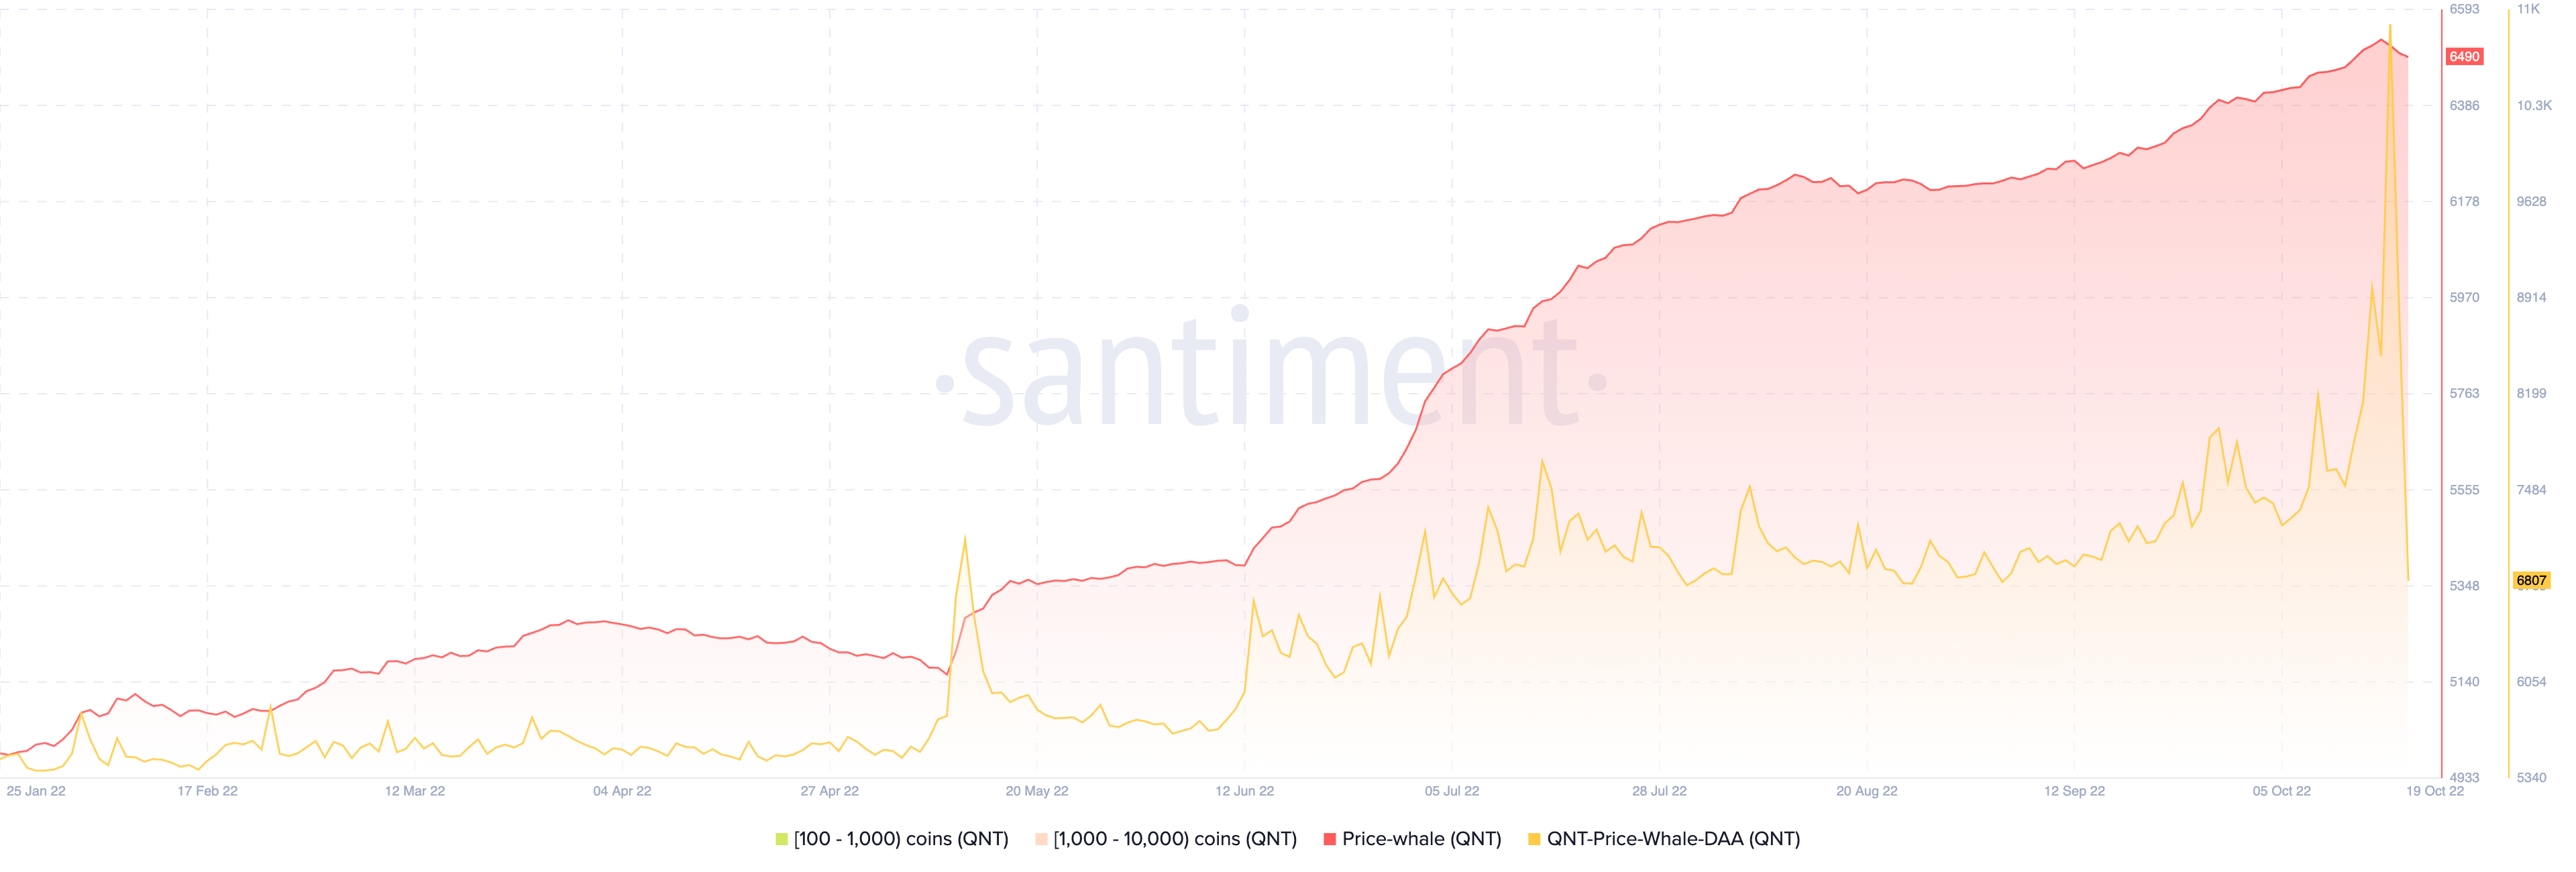
Quant Networks's price versus daily active addresses. Source: Santiment
QNT price downside target
The profit-taking in the Quant Network market comes as its daily relative strength index (RSI) crossed above 70 on Oct. 17, hinting that the asset is overbought.
An overbought RSI does not necessarily mean a strong bearish reversal, however. Instead, it shows that the price has moved upward too quickly and, thus, a correction is becoming increasingly likely before the uptrend could resume.
QNT’s daily RSI corrected to 65 on Oct. 17. Simultaneously, the token’s price dropped toward $185, coinciding with its 0.236 Fib line of the Fibonacci retracement graph shown in the chart below.
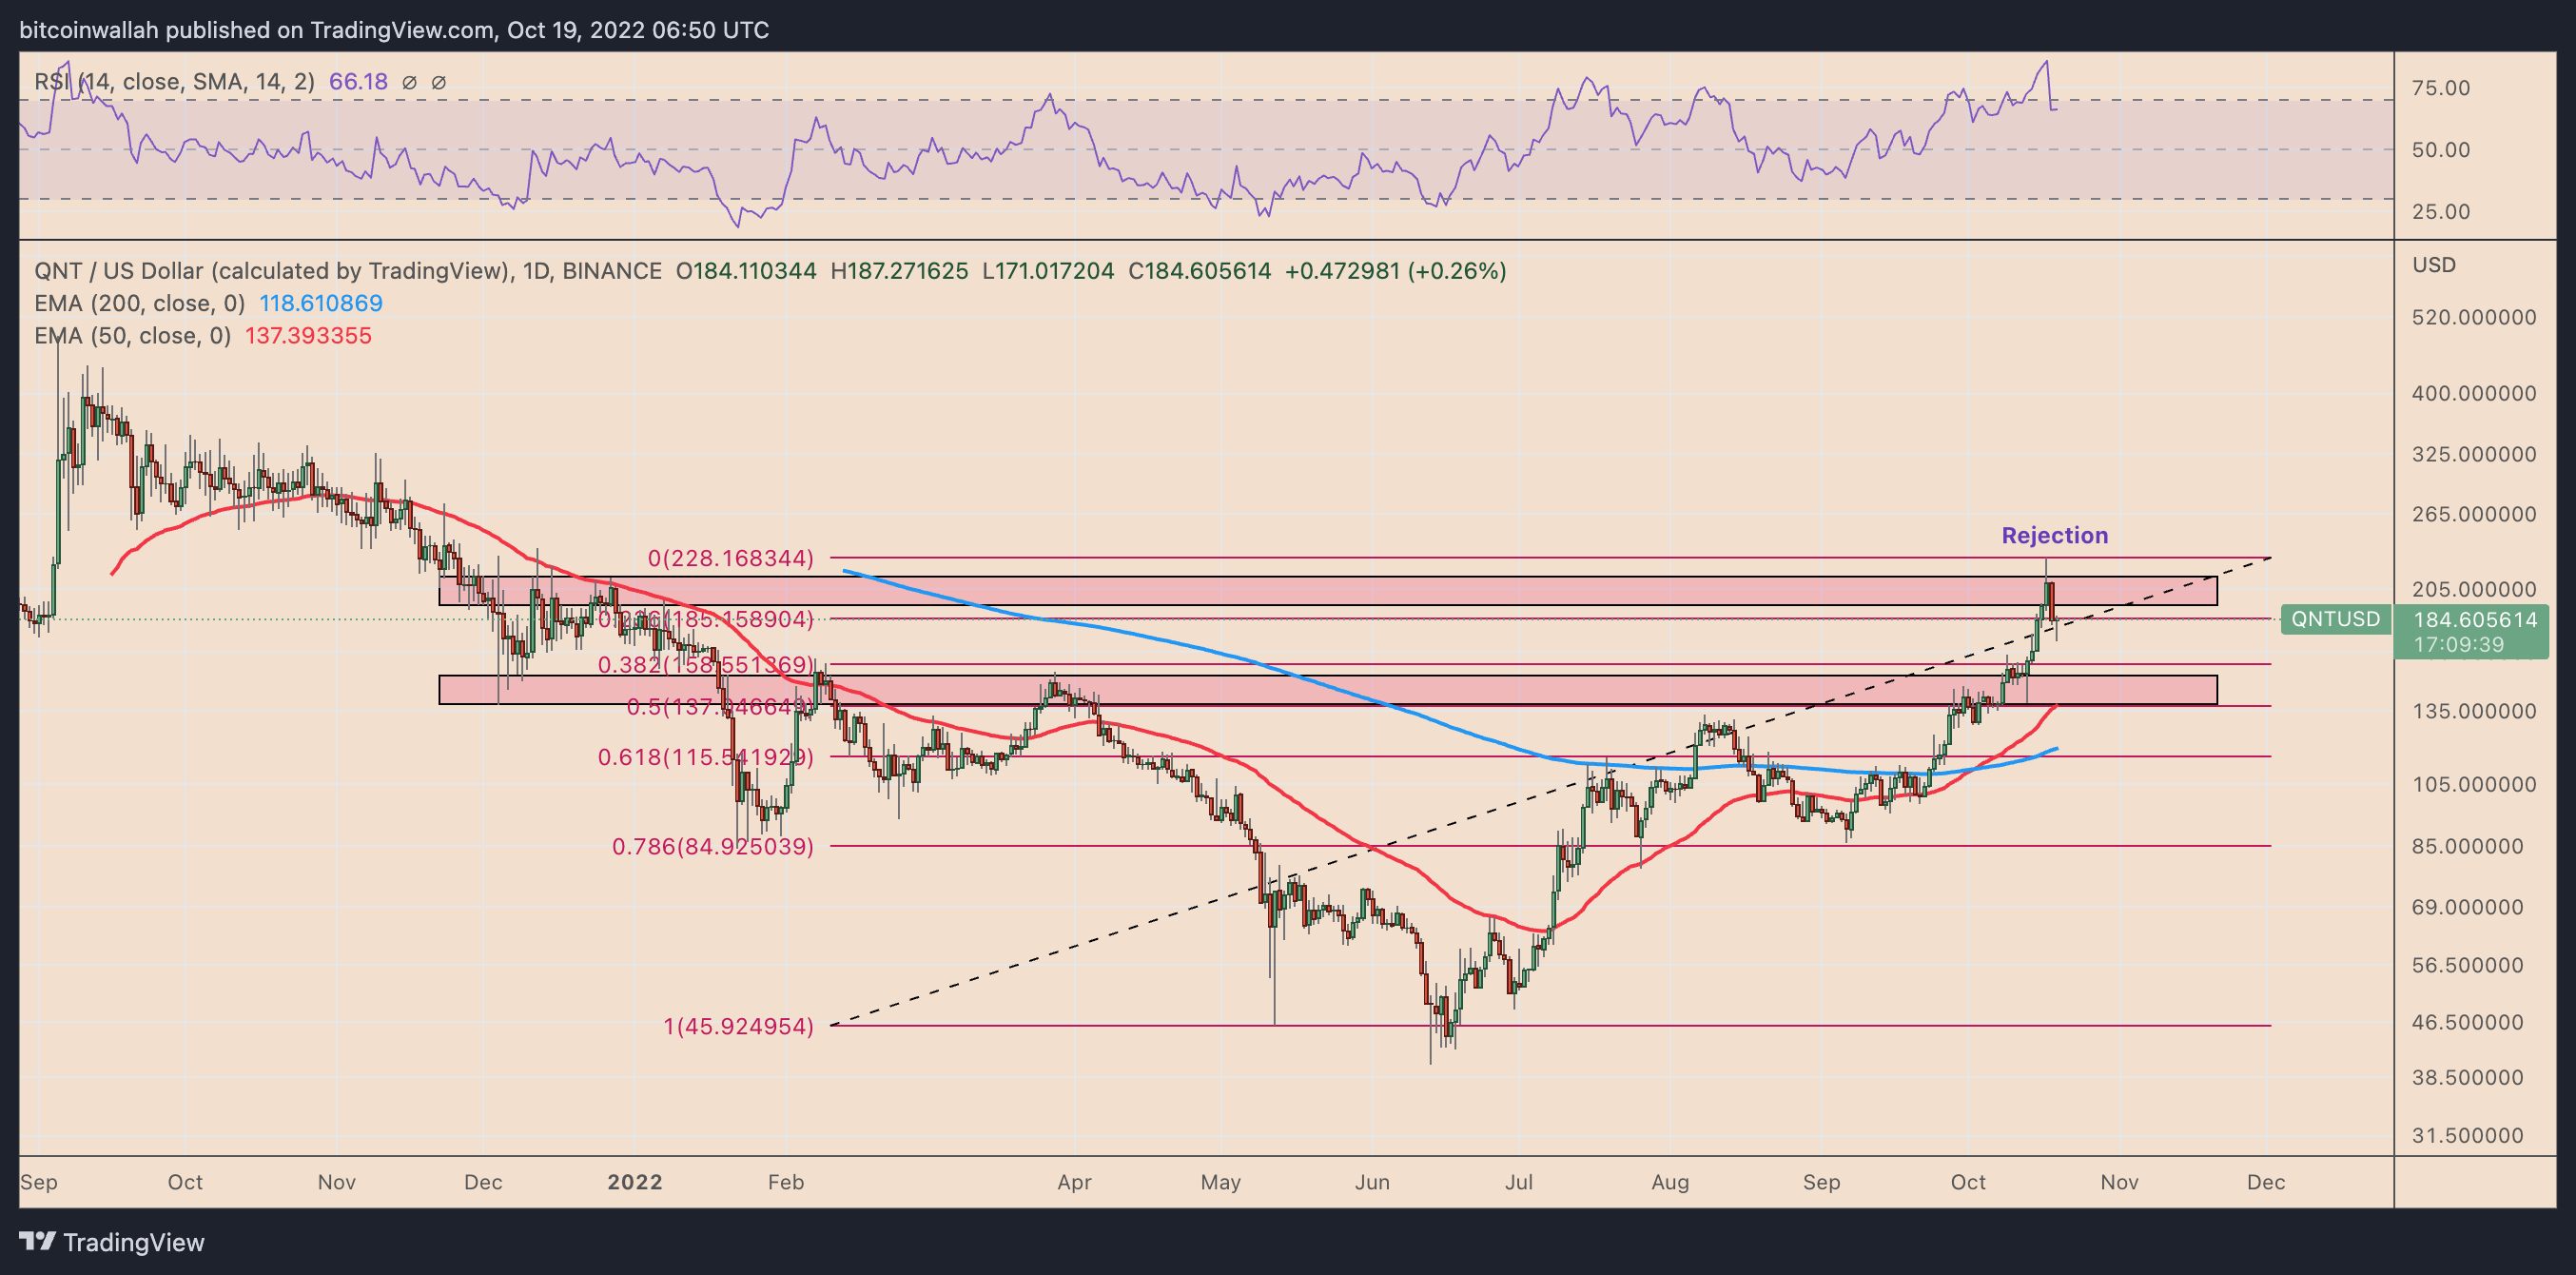
QNT/USD daily price chart. Source: TradingView
The $185-level was instrumental as support in August 2021. But, given the existing profit-taking sentiment, the level may not hold for long, which could result in an extended decline toward the $137-$150 support range.
The area falls between QNT’s 0.382 and 0.5 Fib lines and further coincides with its 50-day exponential moving average (50-day EMA; the red wave in the chart above), creating a strong support confluence. Therefore, a break below $185 could have QNT bears eye $137, a 25% drop, as the ultimate downside target by the end of the month.
QNT whales diminish
The period of Quant Network’s 450% price rally heavily coincided with the increase in the number of addresses holding between 100 QNT and 1,000 QNT tokens, dubbed as “whales” by Santiment.
However, the whale count started dropping on Oct. 16, a day before QNT’s price and DAA topped out. Meanwhile, addresses holding between 1,000 QNT and 10,000 QNT tokens also fell, suggesting that the plunge in the 100-1,000 QNT cohort was due to token distribution, not accumulation.
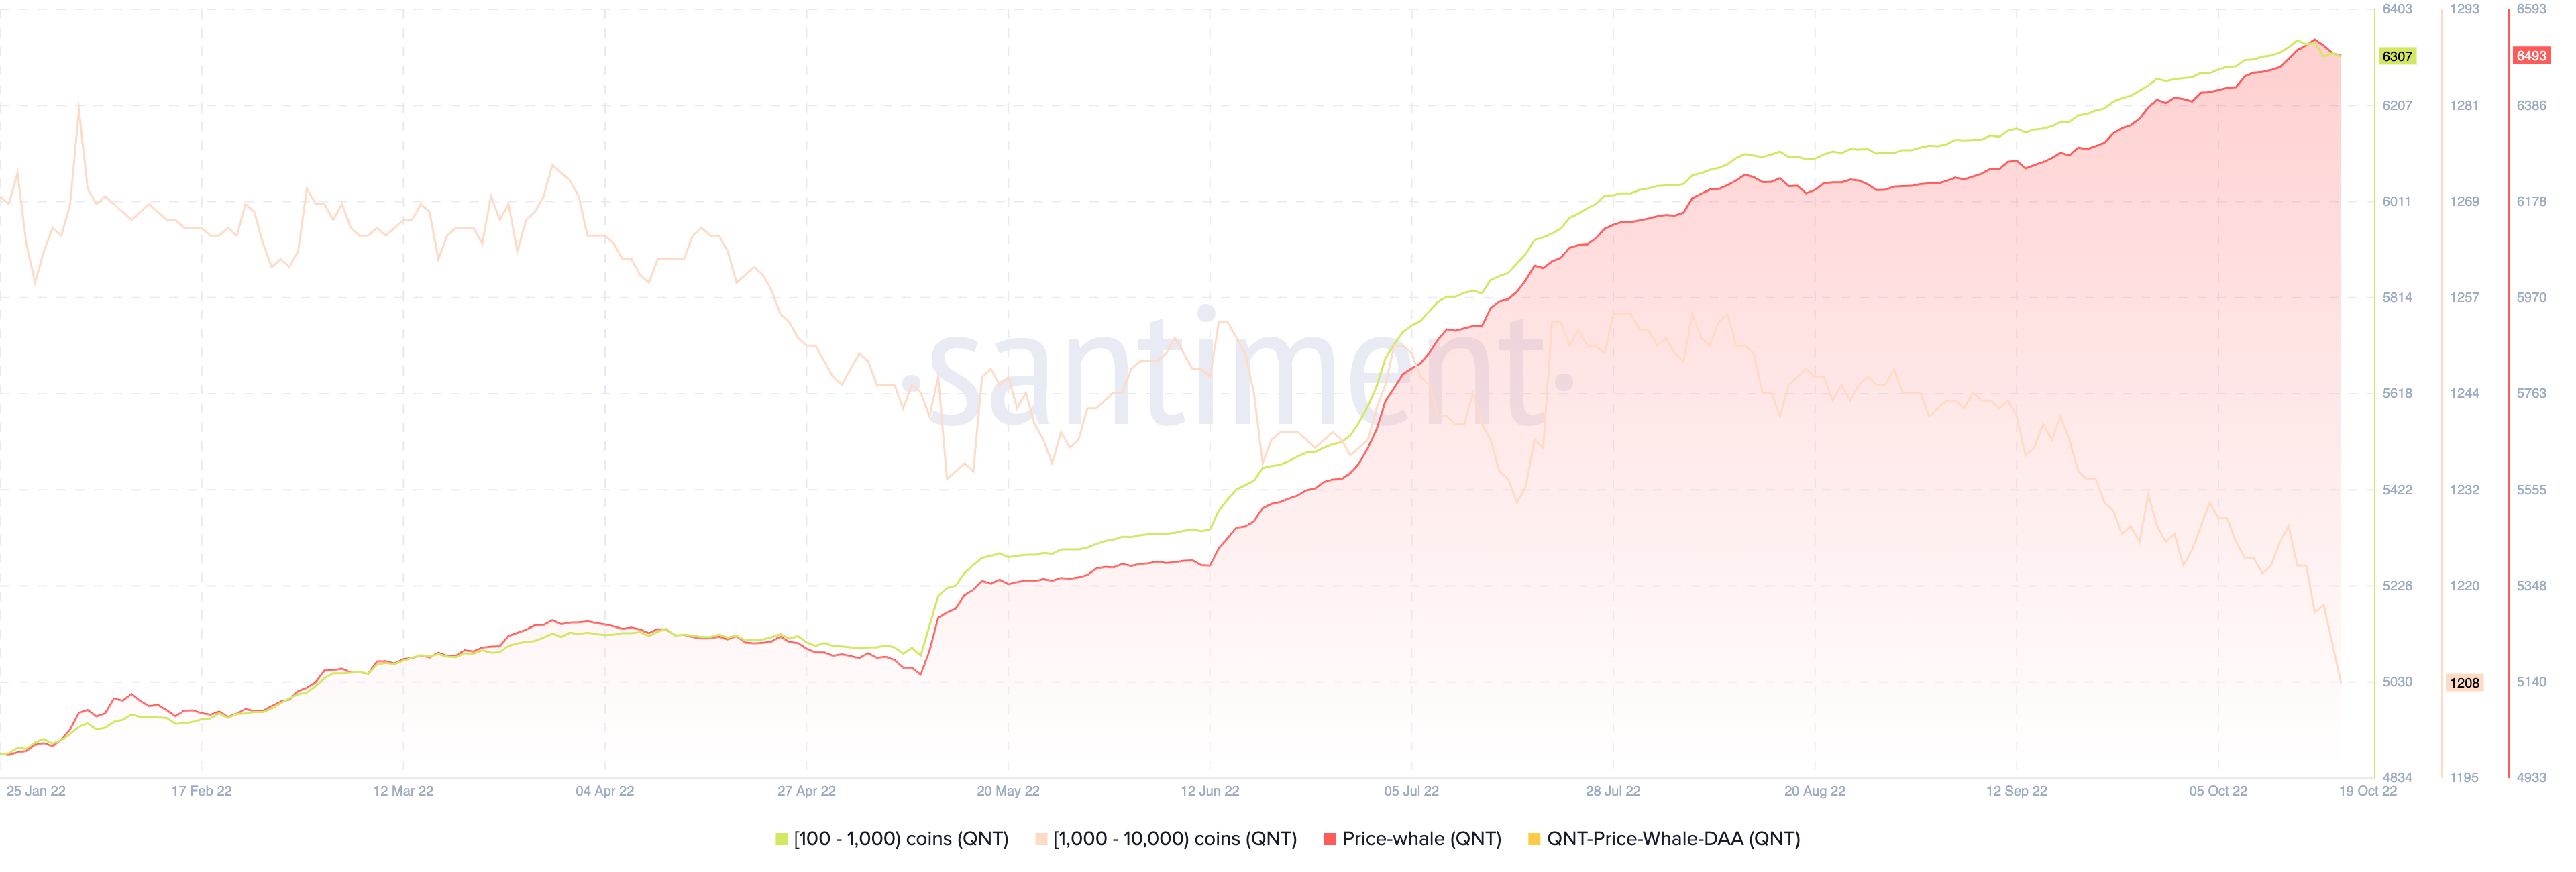
Quant Network addresses holding 100-1,000 QNT and 1,000-10,000 QNT tokens. Source: Santiment
In other words, QNT whales have started selling their holdings near the token’s potential price top, raising possibilities that the decline could continue toward the technical targets, as mentioned above.
Information on these pages contains forward-looking statements that involve risks and uncertainties. Markets and instruments profiled on this page are for informational purposes only and should not in any way come across as a recommendation to buy or sell in these assets. You should do your own thorough research before making any investment decisions. FXStreet does not in any way guarantee that this information is free from mistakes, errors, or material misstatements. It also does not guarantee that this information is of a timely nature. Investing in Open Markets involves a great deal of risk, including the loss of all or a portion of your investment, as well as emotional distress. All risks, losses and costs associated with investing, including total loss of principal, are your responsibility. The views and opinions expressed in this article are those of the authors and do not necessarily reflect the official policy or position of FXStreet nor its advertisers.
Recommended Content
Editors’ Picks

Dogecoin and Bitcoin Cash Price Prediction: Funding rates decrease indicate weakness in DOGE and BCH
Dogecoin and Bitcoin Cash registered 3% and 8% losses on Tuesday following increased selling pressure from the futures market. The decline comes amid large-cap cryptos like Bitcoin, Ether and XRP, holding still with slight gains.

XRP could sustain rally amid growing ETF and SEC vote prospects
Ripple flaunted a bullish outlook, trading at $2.1505 on Tuesday. Investor risk appetite has continued to grow since the middle of last week, propping XRP for a sustainable upward move triggered by the swift decision by US President Donald Trump to suspend reciprocal tariffs for 90 days.

VeChain Price Forecast: VET bulls aim for a double-digit rally
VeChain price hovers around $0.023 on Tuesday after breaking above a falling wedge pattern the previous day; a breakout of this pattern favors the bulls. Bybit announced on Monday that VET would be listed on its exchange. Moreover, the technical outlook suggests rallying ahead, targeting double-digit gains.
Dogecoin, Shiba Inu and Fartcoin price prediction if Bitcoin crosses $100K this week
The meme coin market fell sharply on Monday, shedding 4.8% in market capitalization to settle at $49.25 billion, according to data compiled from CoinGecko. The sell-off coincided with increased volatility across broader crypto markets while investors rotated funds into Bitcoin briefly tested $85,000.

Bitcoin Weekly Forecast: Market uncertainty lingers, Trump’s 90-day tariff pause sparks modest recovery
Bitcoin (BTC) price extends recovery to around $82,500 on Friday after dumping to a new year-to-date low of $74,508 to start the week. Market uncertainty remains high, leading to a massive shakeout, with total liquidations hitting $2.18 billion across crypto markets.

The Best brokers to trade EUR/USD
SPONSORED Discover the top brokers for trading EUR/USD in 2025. Our list features brokers with competitive spreads, fast execution, and powerful platforms. Whether you're a beginner or an expert, find the right partner to navigate the dynamic Forex market.