Three reasons why MATIC price will breakout to a new all-time high at $4.5
- MATIC price is breaking out of an ascending triangle pattern, hinting at a 150% ascent.
- Transactional data shows barely any resistance level ahead for Polygon, suggesting a swift move higher.
- The Layer 2 solution has been at the center of DeFi evolution, making it perfectly positioned for the upcoming bull run.

MATIC price breached a crucial resistance level that has prevented it from rallying four times over the past four months. The recent attempt seems to have an extra oomph behind it, hinting that this run-up could trigger a massive move.
Technicals scream bullish for MATIC price
MATIC price set up roughly four equal highs since June 6 and three higher lows since July 18. Connecting these swing points using trend lines shows the formation of an ascending triangle.
This technical formation forecasts a 150% ascent, determined by measuring the distance between the first swing high and low and adding this to the breakout point at $1.73, which reveals a target of $4.32.
While this move for Polygon might seem straightforward, MATIC price will face $2.04 and $2.21, two significant hurdles before it can retest its all-time high at $2.70. Clearing these blockades will open the path to the target at $4.32.
Using trend-based Fibonacci extension levels, market participants can identify pit stops where MATIC price may head into a price discovery phase. The first barrier is $3.02, which is followed by the 161.8% extension level at $4.5, just above the forecasted target.
This forecast is based on a short-to-mid-term perspective for MATIC price. The longer-term outlook reveals triple digital targets for the Layer 2 token in the upcoming bull run.
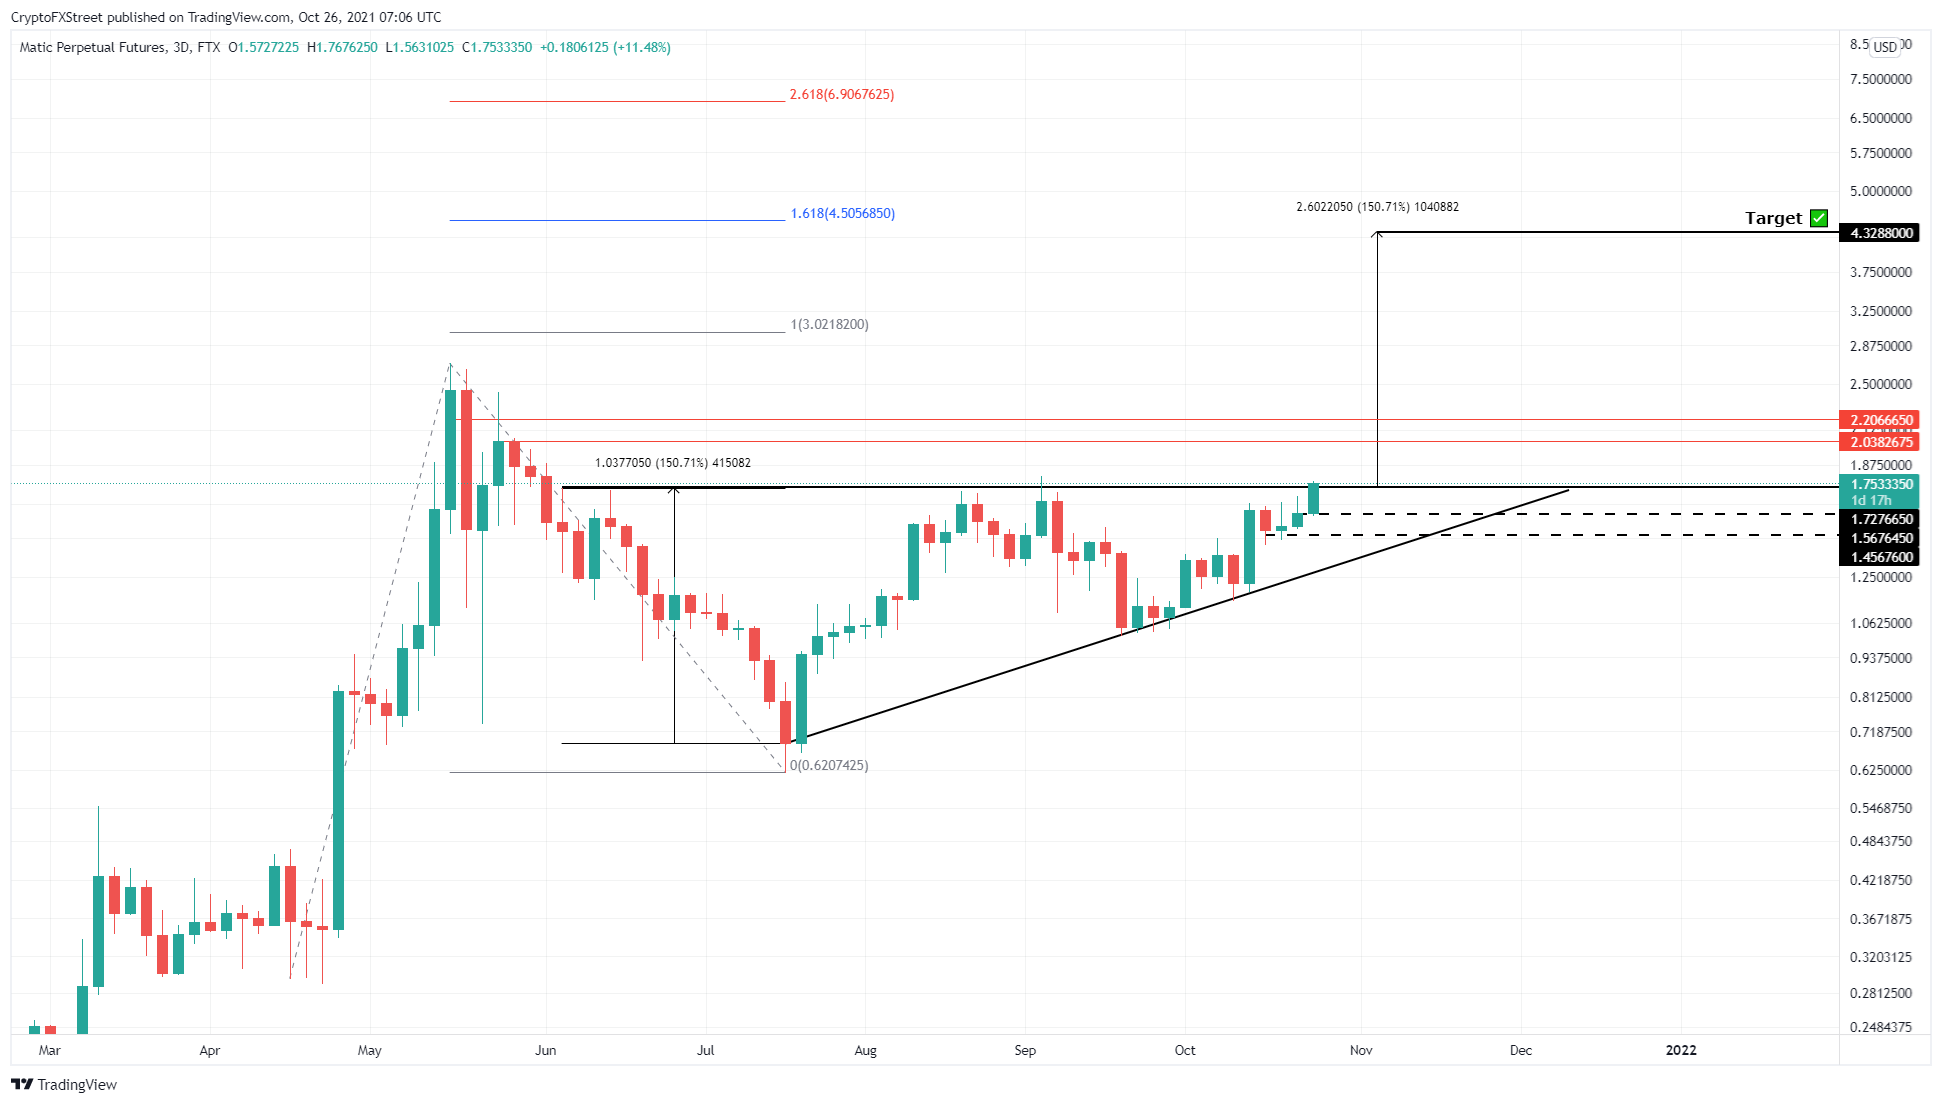
MATIC/USDT 3-day chart
On-chain metrics and growing fundamentals
Supporting the start of a massive uptrend for MATIC price is the increase in daily active addresses (DAA) joining the Polygon blockchain over the past three months. This uptick in the 7-day Moving Average (MA) of DAA suggests that investors and capital are flowing into the market, adding credence to the bullish thesis.
 [13.51.16, 26 Oct, 2021]-637708367200831180.png)
MATIC DAA chart
On a similar note, IntoTheBlock’s Global In/Out of the Money (GIOM) model reveals that the only resistance level that will prevent an ascent in Polygon’s market value is at $1.87. Here, roughly 17.54 thousand addresses purchased 135 million MATIC.
Therefore, a decisive close above $1.87 will flip these underwater investors to profitable, removing the potential sell-side pressure, allowing MATIC price to continue its ascent without anything to hold it back.
In this case, MATIC price will head straight towards its all-time high at $2.70 and beyond.
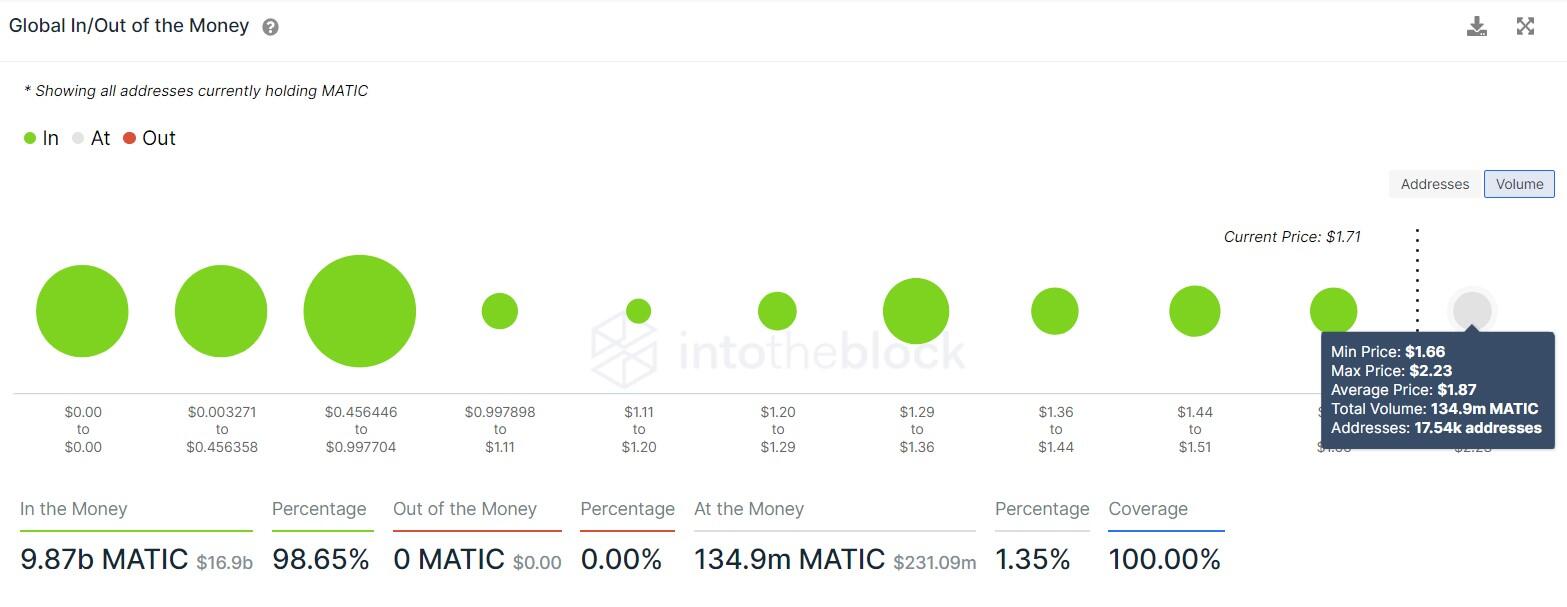
MATIC GIOM chart
The last week saw Polygon network benefit from $188 million in inflows. While daily revenue was up 15%, the number of daily active addresses hit 423,000. Moreover, the Layer 2 network bridged a whopping $188 million in value.
These growing fundamentals hint nothing but bullishness for Polygon, adding a tailwind to the forecast.
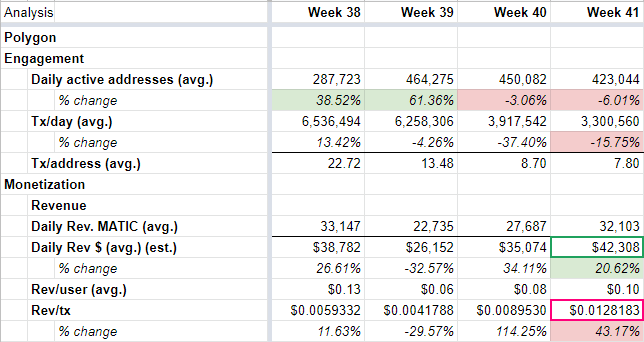
MATIC on-chain metrics chart
Polygon has been at the center of DeFi evolution. From yield farming to NFTs, MATIC has helped users reduce fee costs. Moreover, Bitwise, a popular crypto investment fund manager, has decided to offer Polygon Fund to help make scaling solutions available to investors.
Matt Hougan, Chief Investment Officer at Bitwise, stated that Ethereum’s lack of scaling capabilities had muted its development around NFTs or DeFi. Adding more, Hougan revealed,
Many are working on Ethereum competitors to solve this, but Polygon has seen breakthrough traction with a uniquely complementary solution that boosts Ethereum’s speed and efficiency. Investors have been asking about this rising star. With the new Bitwise Polygon Fund launching today, we’re excited to continue helping investors gain access to the expanding set of opportunities emerging in crypto.
It should be noted that this new fund will only be available to accredited investors with a $10,000 minimum investment and weekly redemptions.
The launch of the Bitwise Polygon Fund provides strategic exposure to @0xPolygon, one of the most essential innovations behind DeFi, NFTs, and gaming. Learn more: https://t.co/j67VV8uFSI pic.twitter.com/aZO20n62mu
— Bitwise (@BitwiseInvest) October 20, 2021
While things are looking up for MATIC price, a breakdown of the $1.73 support floor will signal a weakness among buyers. In this case, Polygon bears are likely to knock it down toward the $1.57 demand barrier, a breakdown of which will likely push the Layer 2 token below the ascending triangle’s lower trend line, invalidating the bullish thesis. In such a situation, MATIC price could revisit the $1.47 support level.
Author

Akash Girimath
FXStreet
Akash Girimath is a Mechanical Engineer interested in the chaos of the financial markets. Trying to make sense of this convoluted yet fascinating space, he switched his engineering job to become a crypto reporter and analyst.


