• Ethereum price is at the edge of falling another 10% as bearish momentum grows.
  • There is an increase of sellers in the market, as the bears target $2,853 next.
  • Sliding below $3,164 could spell trouble for the bulls.

Ethereum price could be at risk of falling further following a break of a significant support trend line. ETH is on the verge of sliding 10% toward $2,853 if selling pressure increases and a reliable foothold is not found. 

Ethereum price prepares for deep plunge

Ethereum price has sliced below the lower boundary of the symmetrical triangle on the 12-hour chart, suggesting a bearish outlook. The measured move given by the prevailing chart pattern is a 25% drop toward $2,853. ETH is already halfway to meeting its pessimistic target. 

Unfortunately, there does not seem to be an abundance of reliable lines of defense for Ethereum price. The first foothold will appear at the September 26 high at $3,164, then at the September 24 high at $2,979.

However, if the aforementioned levels fail to hold, Ethereum price could be at risk of meeting the bearish target at $2,853, coinciding with the support line given by the Momentum Reversal Indicator (MRI) and the 127.2% Fibonacci extension level. 

IntotheBlock’s In/Out of Money Around Price (IOMAP) model indicates that the first line of defense for Ethereum price is located near the largest cluster of buyers in the money of 952,000 addresses who purchased 792,000 ETH at an average price of $3,175. 
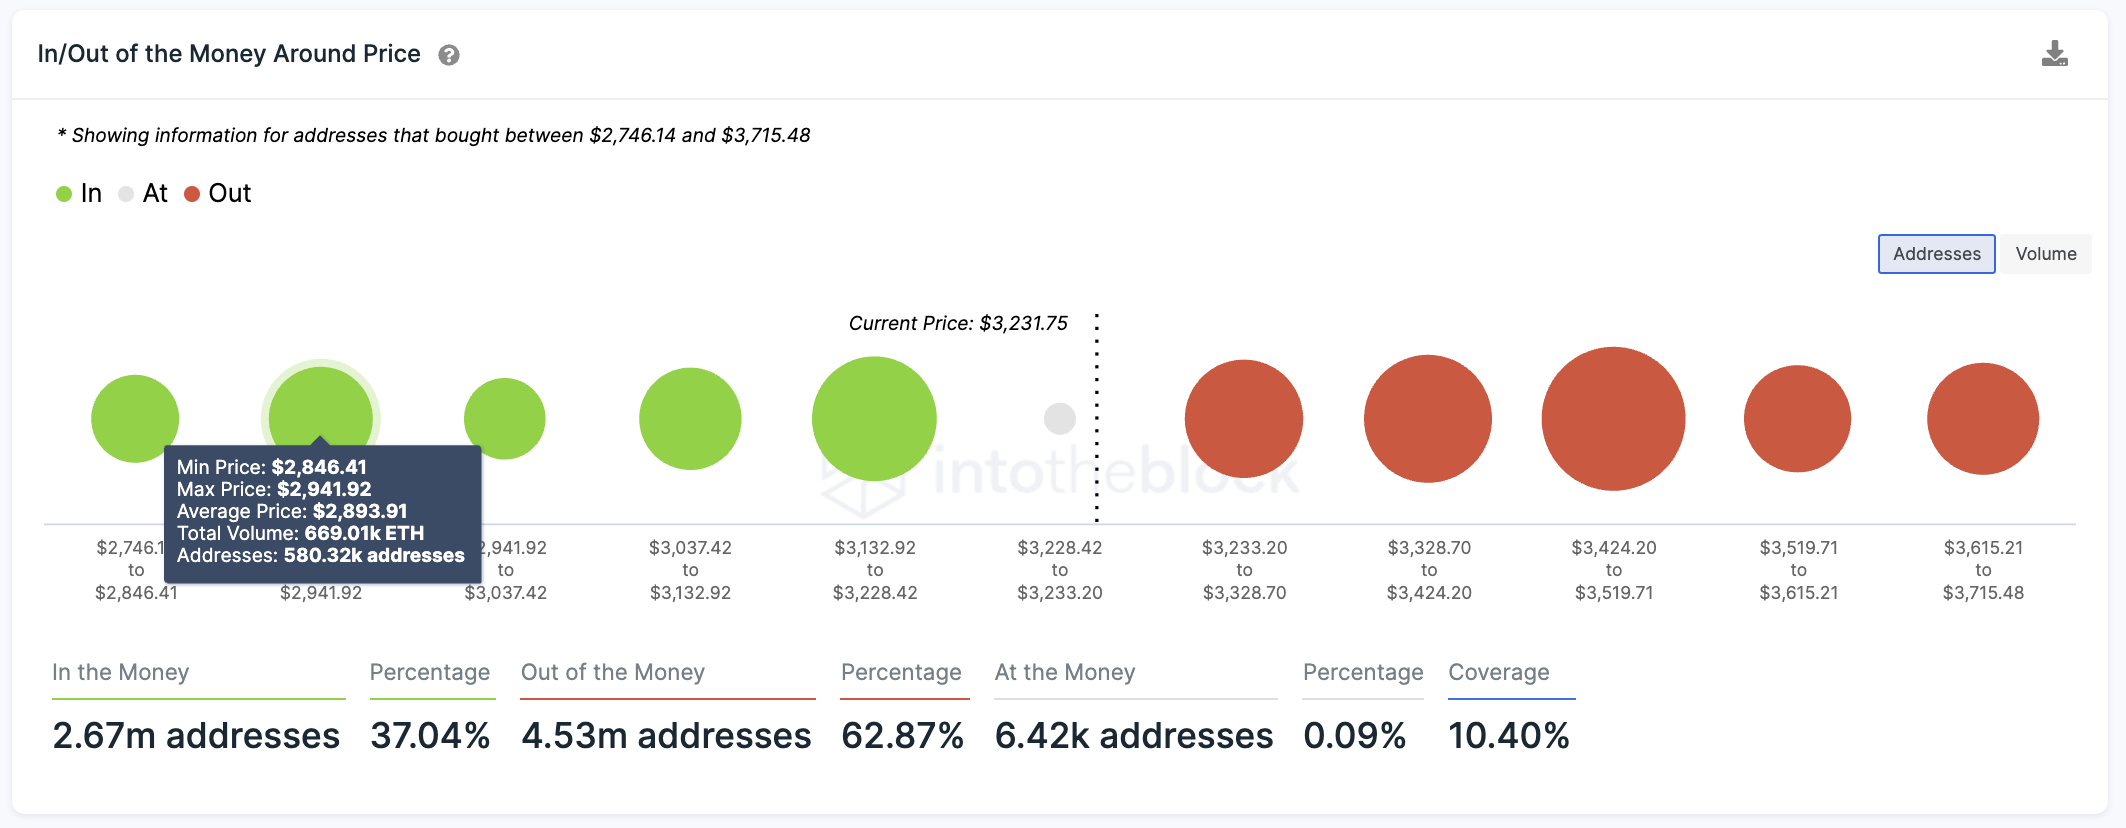
ETH IOMAP

ETH IOMAP

However, if ETH loses the aforementioned foothold, the next largest cluster of buyers, with 580,000 addresses having purchased 669,000 ETH at an average price of $2,893, indicates that this area is the next strongest area of support.

In addition, the Arms Index (TRIN) which gauges overall market sentiment suggests that there is an uptick of sellers in the market, indicating some investors panicking, leading to a panic sell-off.

ETHUSDT

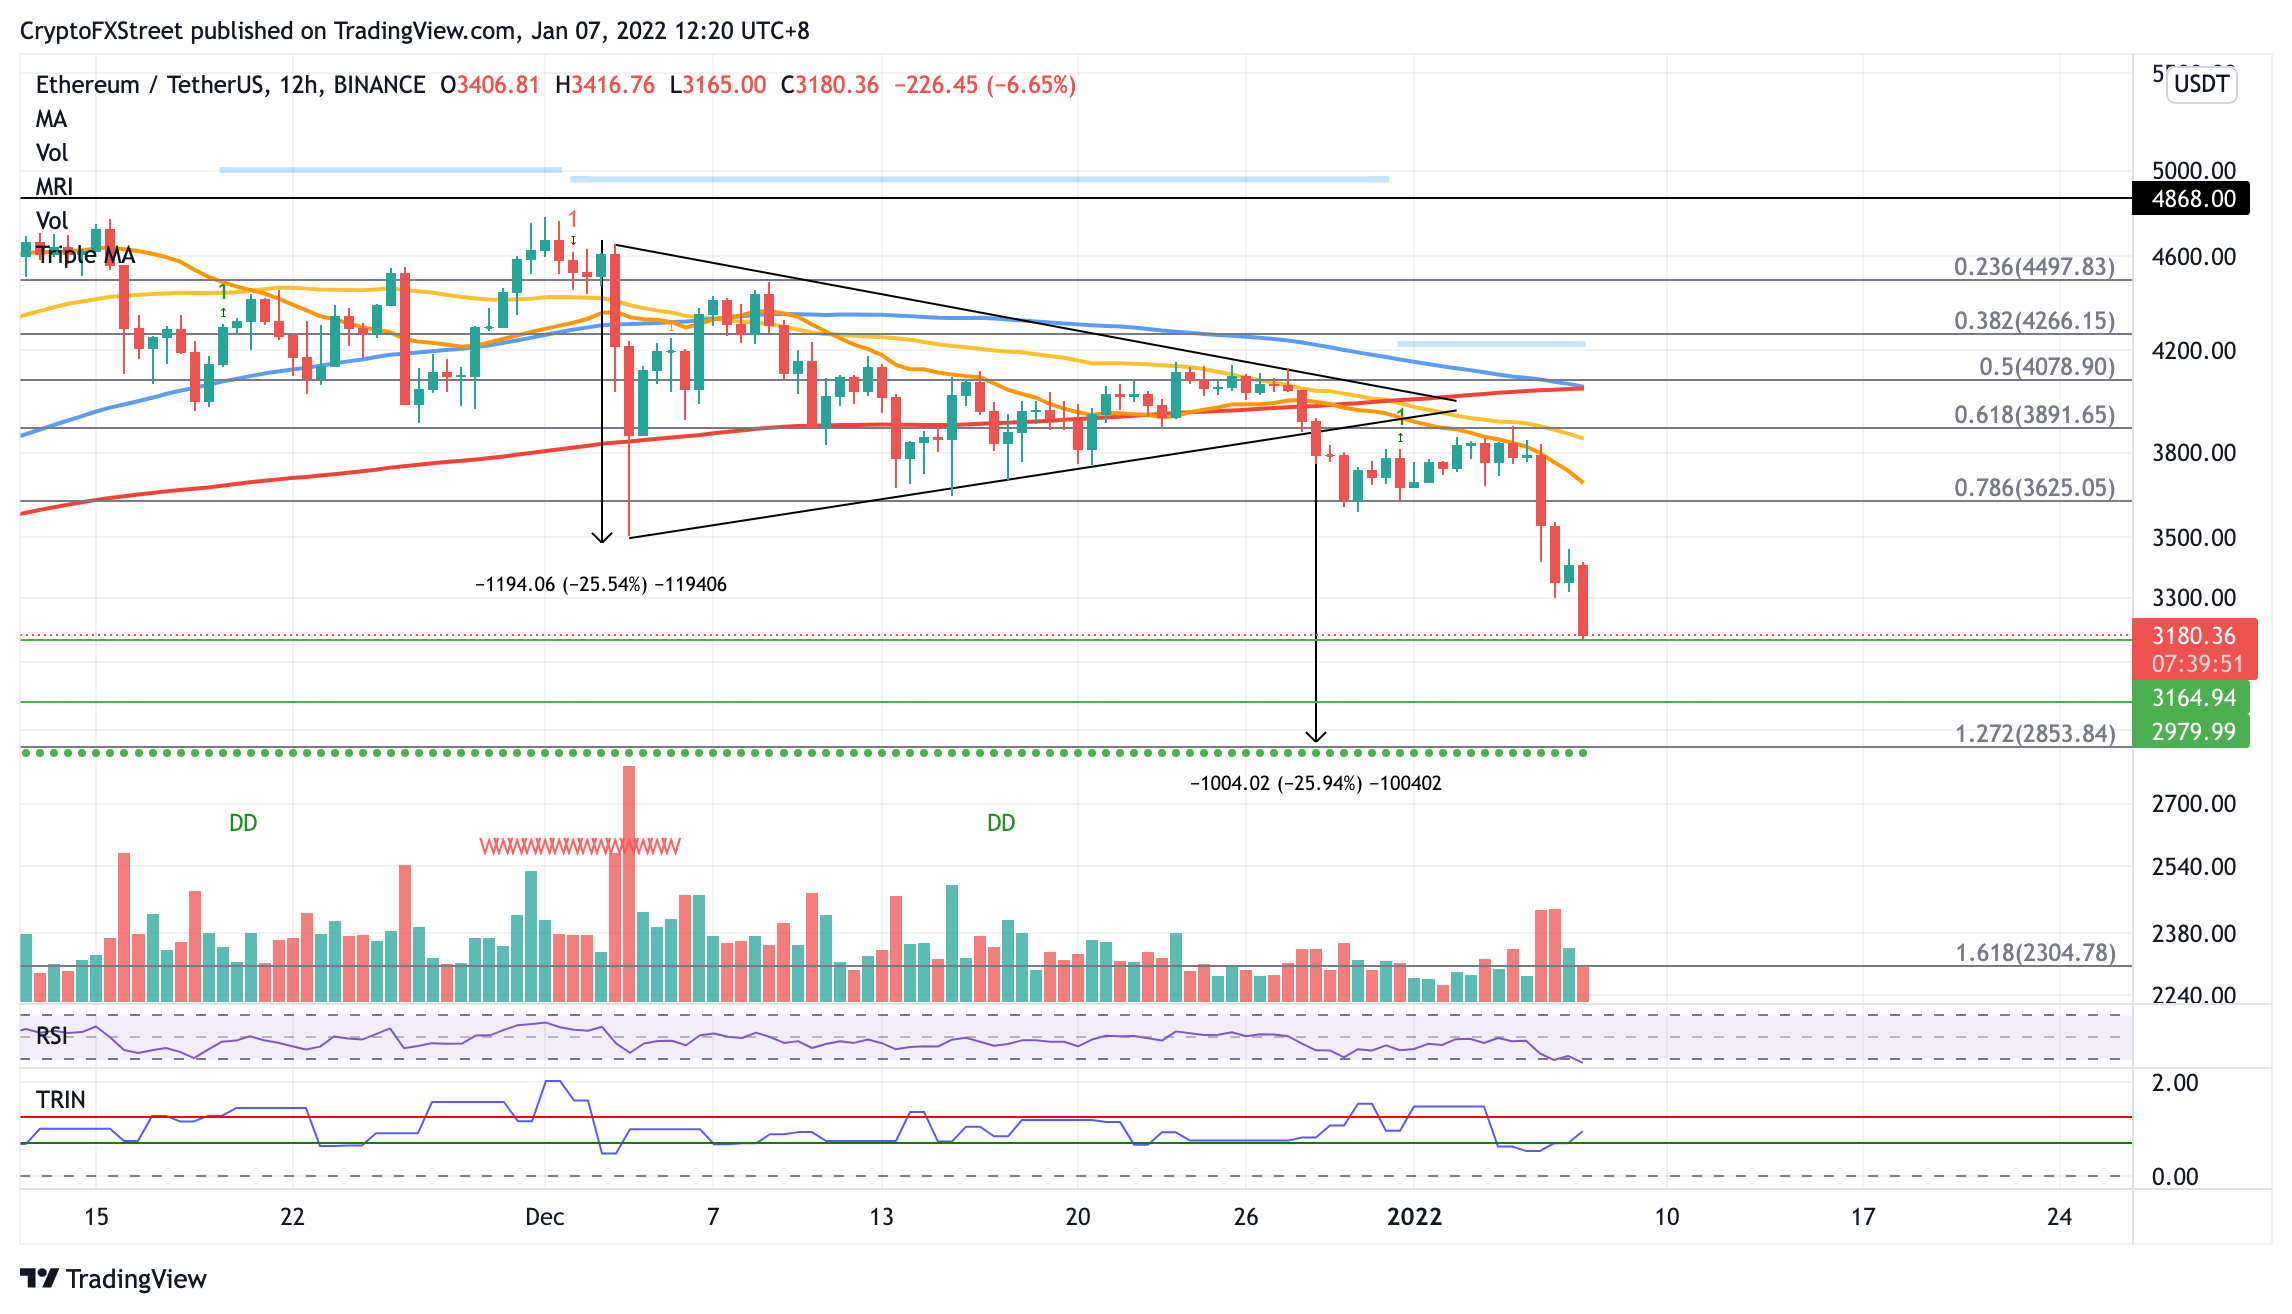
ETH/USDT 12-hour chart

However, if the bulls manage to reverse the period of underperformance, The first area of resistance may appear at the 78.6% Fibonacci retracement level at $3,625. Additional headwinds may emerge at the 21 twelve-hour Simple Moving Average (SMA) at $3,697, then at the 61.8% Fibonacci retracement level at $3,891, coinciding with the 50 twelve-hour SMA.


Note: All information on this page is subject to change. The use of this website constitutes acceptance of our user agreement. Please read our privacy policy and legal disclaimer. Opinions expressed at FXstreet.com are those of the individual authors and do not necessarily represent the opinion of FXstreet.com or its management. Risk Disclosure: Trading foreign exchange on margin carries a high level of risk, and may not be suitable for all investors. The high degree of leverage can work against you as well as for you. Before deciding to invest in foreign exchange you should carefully consider your investment objectives, level of experience, and risk appetite. The possibility exists that you could sustain a loss of some or all of your initial investment and therefore you should not invest money that you cannot afford to lose. You should be aware of all the risks associated with foreign exchange trading, and seek advice from an independent financial advisor if you have any doubts.

Join Telegram

Recommended content


Recommended Content

Editors’ Picks

Ripple on-chain metrics show bullish signs amidst legal struggle with SEC, XRP eyes recovery

Ripple on-chain metrics show bullish signs amidst legal struggle with SEC, XRP eyes recovery

Ripple made a comeback above $0.48 on Tuesday and hovers above that level in Wednesday’s European session. Ripple on-chain metrics such as transaction volume and Network Realized Profit/Loss have turned bullish, supporting a recovery in the altcoin. 

More Ripple News

Bitcoin price falls amidst German government transfers, miners activity

Bitcoin price falls amidst German government transfers, miners activity

Bitcoin (BTC) extends correction on Wednesday and hovers around $61,000 after finding resistance near the $64,000 level on Monday. Recent on-chain data indicates heightened selling activity from Bitcoin miners early in the week. 

More Bitcoin News

Crypto Today: Bitcoin erases gains from end of June, Ethereum declines while Ripple holds

Crypto Today: Bitcoin erases gains from end of June, Ethereum declines while Ripple holds

Bitcoin wipes out gains from the last week of June and falls below $60,000 on Wednesday. Ethereum and top altcoins ranked by market capitalization erased gains as the inflation outlook worsened. Ripple holds on to recent gains and hovers above $0.48 on Wednesday. 

More Cryptocurrencies News

Three reasons why altcoins could shake off losses this week

Three reasons why altcoins could shake off losses this week

On-chain data from Santiment shows that altcoins are currently in the opportunity zone, or generating buy signals. The top three altcoins in the buy zone are Basic Attention Token (BAT), Chromia (CHR), and Highstreet (HIGH), per Santiment. 

More Altcoins News

Bitcoin: BTC price correction could end in July, according to seasonal data

Bitcoin: BTC price correction could end in July, according to seasonal data

Bitcoin (BTC) price appears poised for a decline this week, influenced by slight outflows in US spot ETFs, selling activity among BTC miners, and a combined transfer of 4,690.28 BTC to centralized exchanges by the US and German governments.

Read full analysis

BTC

ETH

XRP