Three reasons why Ethereum could rally to $2,000
- Ethereum price has struck intimidating support between the 61.8% Fibonacci retracement level and the June 26 low.
- ETH four-hour Relative Strength Index (RSI) is flashing an oversold condition for the first time since July 13.
- IntoTheBlock In/Out of the Money Around Price (IOMAP) metric highlights notable latent support and minor resistance against a rebound.

Ethereum price touched the rally’s 61.8% retracement level and the June 26 low today before catching a soft bounce. The test of the formidable support aligned around $1,700 combined with an emerging overbought condition on a lower timeframe does project a bounce for ETH that may extend to $2,000 or more.
Ethereum price endures, as potent support keeps altcoin from the abyss
Since the May crash, Ethereum price has sketched out a descending triangle with the lower horizontal line coordinated by the May 23 low of $1,728, the June 22 low of $1,700, the June 26 low of $1,717 and finally, the 61.8% Fibonacci retracement level of the 2020-2021 advance at $1,730. The combination creates an imposing level of support that will be a challenge to overcome, leaving ETH balancing on the edge of a more profound decline.
If the support holds, Ethereum price is projected to rally to a trifecta of resistance framed by the always instructive February high of $2,041, the 2020 ascending trend line at $2,070 and the 200-day simple moving average (SMA) at $2,077. A rebound to the strategically important moving average would yield an 18% rebound from the current price.
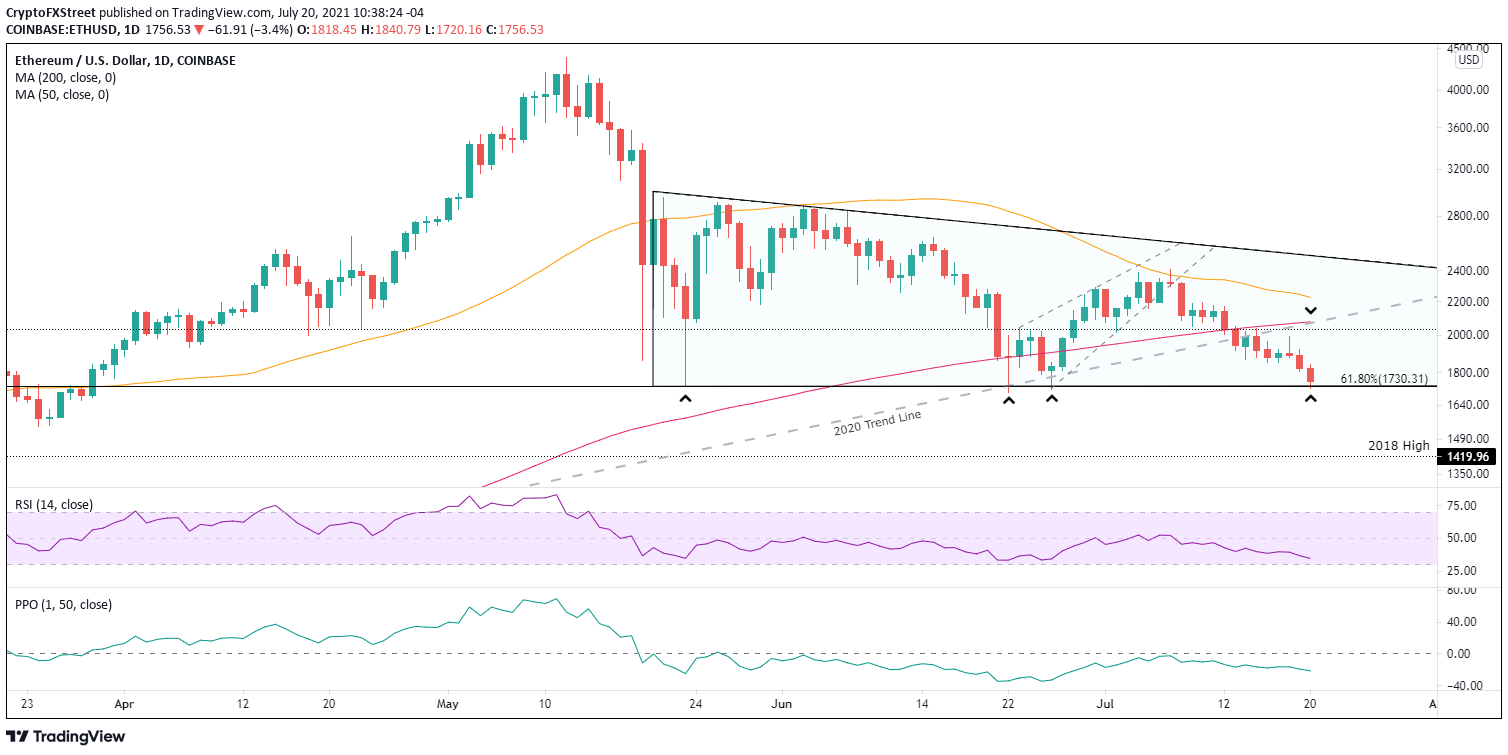
ETH/USD daily chart
Ethereum price selling reaches an extreme, potential for a squeeze higher
During notable declines, cryptocurrencies strike oversold readings first on the lower timeframes, each offering the potential for short-term thrust higher or the beginning of a new, substantial rally. When those oversold readings coincide with a strategic support level or levels, the event carries more significance in the evaluation of price structure.
Overnight, Ethereum price struck an oversold reading on the four-hour RSI as ETH tested the support between $1,700 and $1,730. The rebound has been gradual, but it suggests that the coincidence of the oversold reading with the test of crucial support has provoked a timely opportunity to pursue a pilot buy in ETH.
As can be noted on the chart, the last four-hour RSI oversold reading was followed by a 9% rebound to the February high, and the condition did not coincide with a strategic support level.
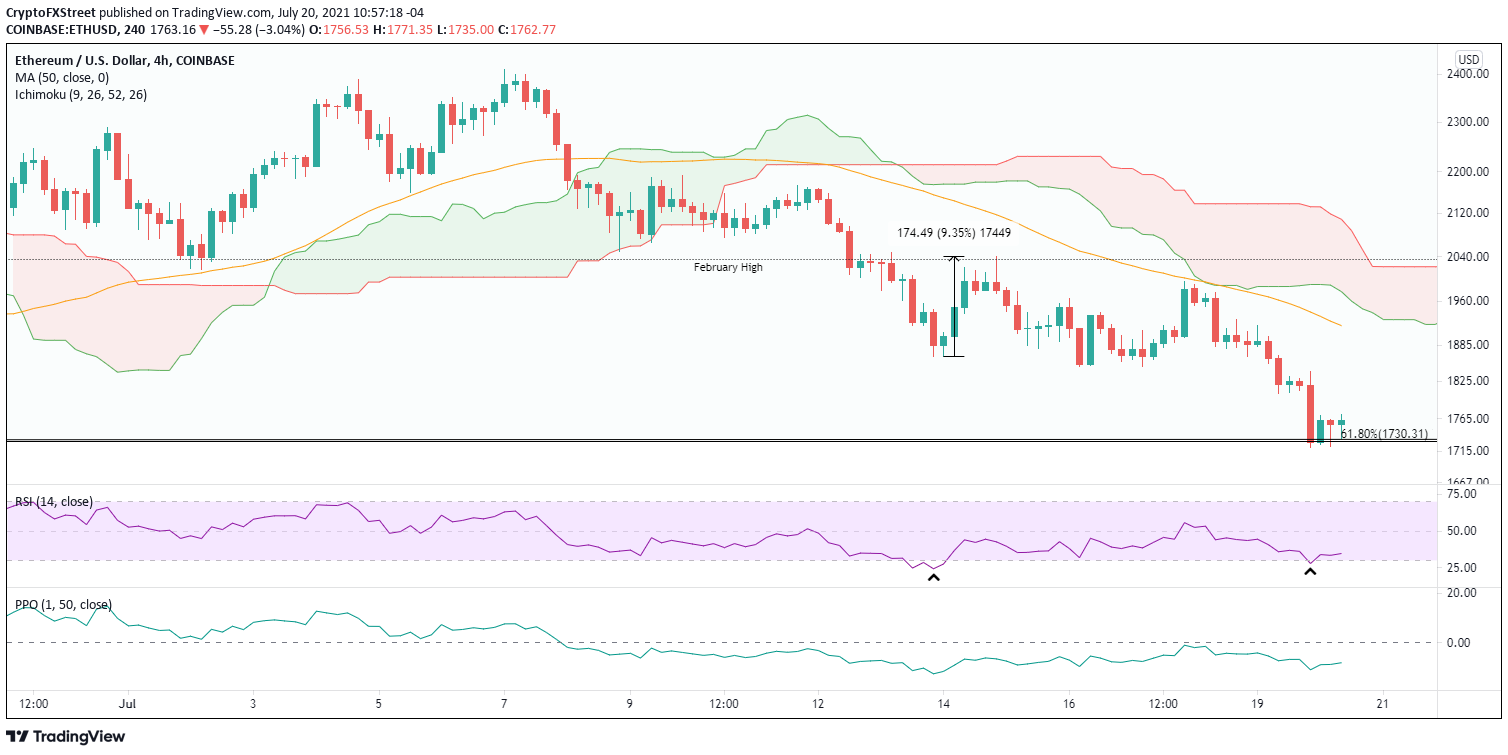
ETH/USD 4-hour chart
Ethereum price comforted by latent support and limited resistance
The most recent IntoTheBlock In/Out of the Money Around Price (IOMAP) metric identifies a big support cluster (in the money addresses) just below $1,700. The cluster ranges from $1,640 to $1,690, with 409.04k addresses holding 9 million ETH at an average price of $1,670. Therefore, if Ethereum price does fall below $1,700, it should be quickly met with support within 30-40 points. It is a minor fall in comparison to the upside potential.
In terms of resistance (out of the money addresses), the clusters show minor resistance until the $1,950 to $2,000 range, where 326.68k addresses hold 8.47 million ETH with an average price of $1,971. The upper part of the range is near the projected technical resistance levels articulated above.

ETH IOMAP - IntoTheBlock
It is evident by the position of Ethereum price today that the smart contracts giant is at an inflection point for this decline as it tests critical support with a cryptocurrency complex awash in red. However, the commanding support between $1,700 and $1,730 offers a compelling opportunity to initiate pilot buys. Additionally, the presence of an oversold condition on the four-hour chart reflects at least a short-term exhaustion of selling pressure, thereby reinforcing the opportunity.
Moreover, the presence of verifiable support just below $1,700 should limit any further weakness and create the potential for a bear trap and a sling-shot formation that would spring Ethereum price higher. ETH should not be restricted by heavy resistance confirmed by the low number of addresses out of the money until it reaches the technical target of just over $2,000.
In persistent declines, the market conditions are fluid, some support levels gaining allegiance and others not. Nevertheless, the convergence of the technical support, oversold condition and balance of in/out of the money is persuasive. It could disrupt the intimidating situation of constant selling into a short but profitable trade to the upside.
Here, FXStreet's analysts evaluate where ETH could be heading next.
Author

Sheldon McIntyre, CMT
Independent Analyst
Sheldon has 24 years of investment experience holding various positions in companies based in the United States and Chile. His core competencies include BRIC and G-10 equity markets, swing and position trading and technical analysis.


