Three reasons why Cardano could rally 60%
- Cardano price triggers a large symmetrical triangle pattern with yesterday’s close above the upper trend line.
- ADA/BTC is nearing a critical support level with the intra-day Relative Strength Indexes (RSI) flashing a bullish momentum divergence.
- ADA IOMAP metric shows one more barrier before the digital asset can march higher.

Cardano price has been shaping a symmetrical triangle pattern during the multi-month corrective process, with the July lows failing to trigger the formation on a daily close. ADA still encounters selling pressure below the 2018 high of $1.40, confirmed by the IOMAP metric, but beyond the intimidating resistance, there is an open zone for the cryptocurrency to climb. Moreover, the ADA/BTC pair indicates that Cardano price is closing in on renewed relative strength after a corrective period.
Cardano price refuses to fall, creates a trap
On July 20, Cardano price traded below the lower trend line of the symmetrical triangle with sights set on support layered from $1.00 to $0.90. Still, the cryptocurrency reversed the weakness to close above the trend line, creating a bear trap.
Cardano price jumped 11% higher the next day off the oversold condition, kicking off a new rally that has consisted of six up days over the last seven days, highlighted by yesterday’s attempt to reclaim the critical 2018 high at $1.40. ADA struggled with the level in February, March and April before releasing in May with an 80% advance.
The measured move of the symmetrical triangle pattern is near 63%, signaling a Cardano price target of $2.01, putting ADA less than 30% away from the all-time high of $2.51 printed on May 16.
Resistance may persist around $1.40 in the short term, but an improving environment in the cryptocurrency complex offers a tailwind for the first time in two months.
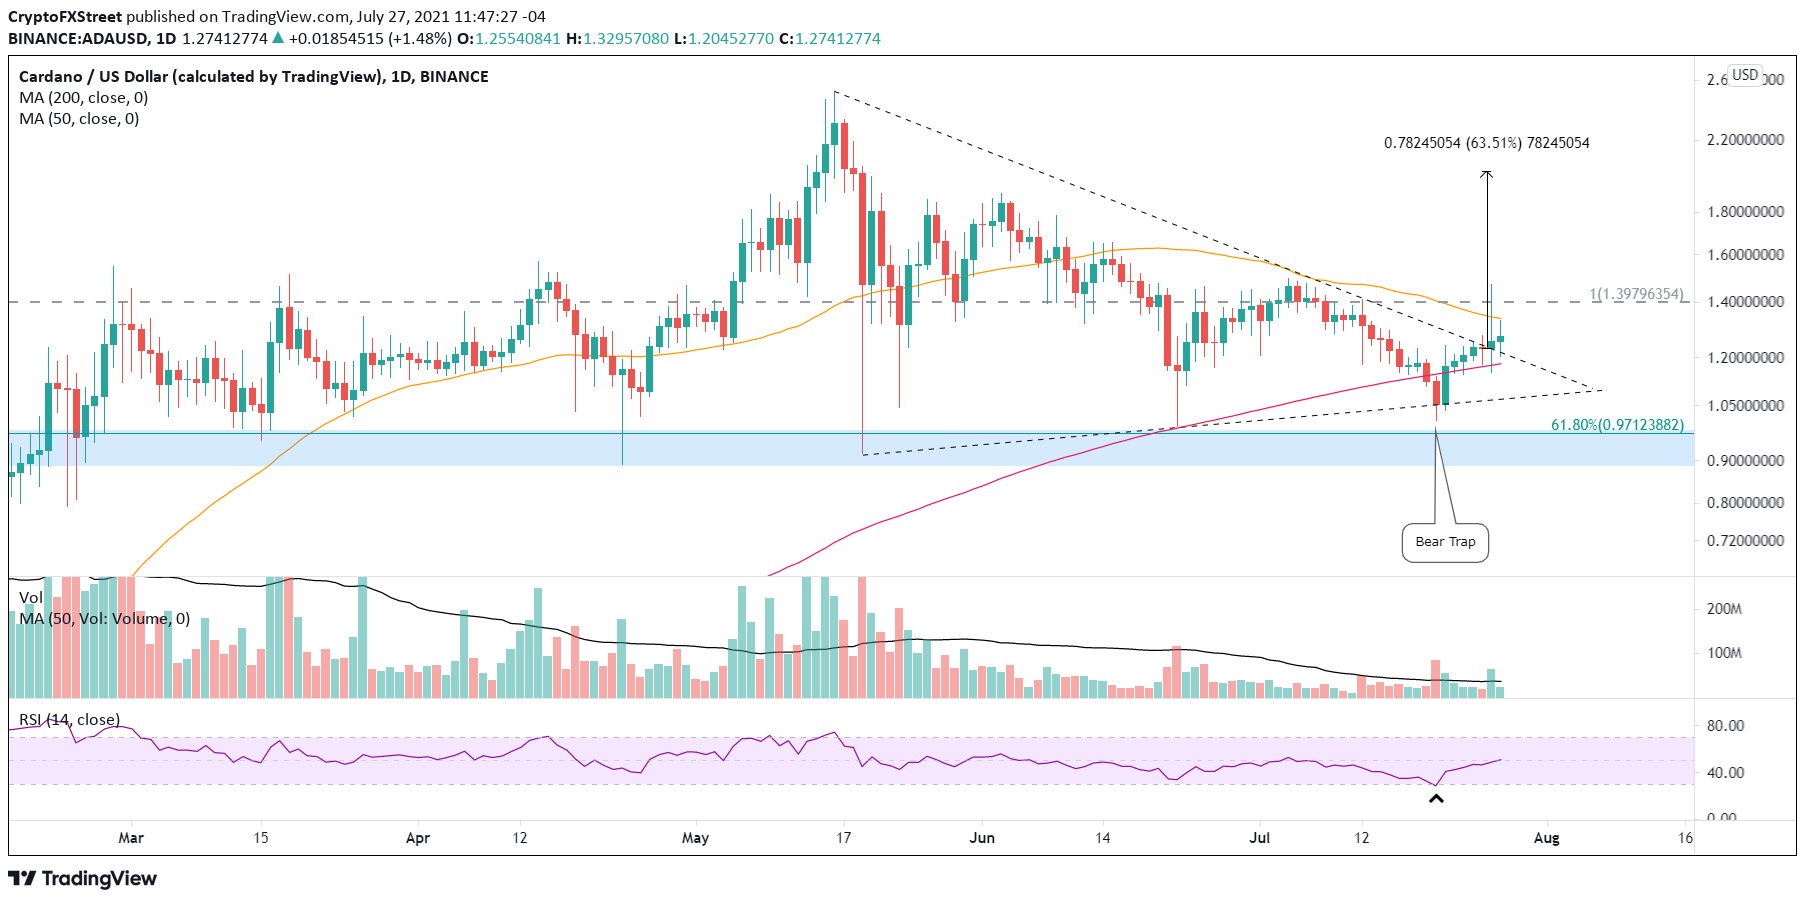
ADA/USD daily chart
Cardano price to begin a period of outperformance
Since the beginning of June, the ADA/BTC pair has been expressing a period of underperformance, taking it down near the February high of $0.00003198 and the first oversold reading on the daily Relative Strength Index (RSI) since the December 2020 lows.
On the intra-day charts, the ADA/BTC pair shows a bullish momentum divergence as the RSI is not printing a new low with price, indicating that downside momentum is dissipating.
The oversold reading on the daily chart, the compelling support of the February high and the emerging bullish momentum divergences on the intra-day charts combine to present a high probability opportunity to participate in a new period of outperformance for Cardano price versus Bitcoin, the flagship cryptocurrency.
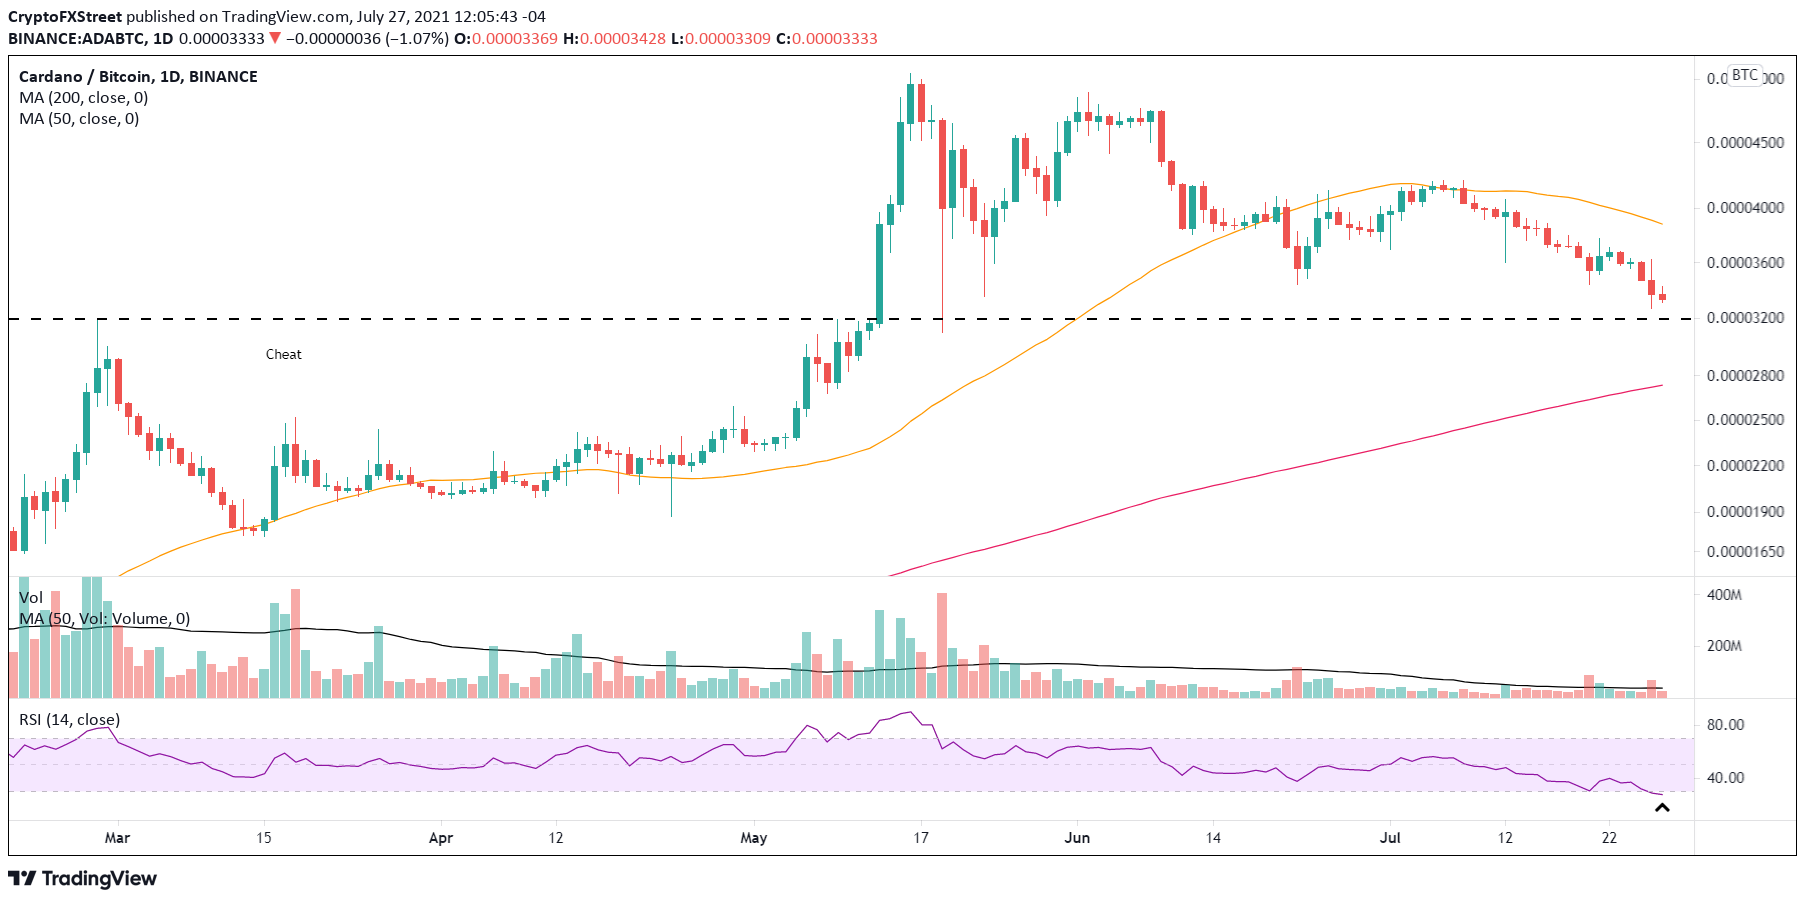
ADA/BTC daily chart
Cardano price has one more challenge before blue skies
After a two-month correction, there are layers of resistance that are inflection points for a renewed uptrend. In the case of ADA, the IntoTheBlock In/Out of the Money (IOMAP) metric shows a notable range of resistance (out of the money addresses) between $1.31 to $1.35, where 188.87k addresses own 3.7 billion ADA at an average price of $1.33. The average price corresponds to the 50-day simple moving average (SMA), also at $1.33.
A successful breakout above the cluster of out-of-the-money addresses frees Cardano price to reclaim the 2018 high of $1.40 as the size of resistance drops while the momentum should be building.
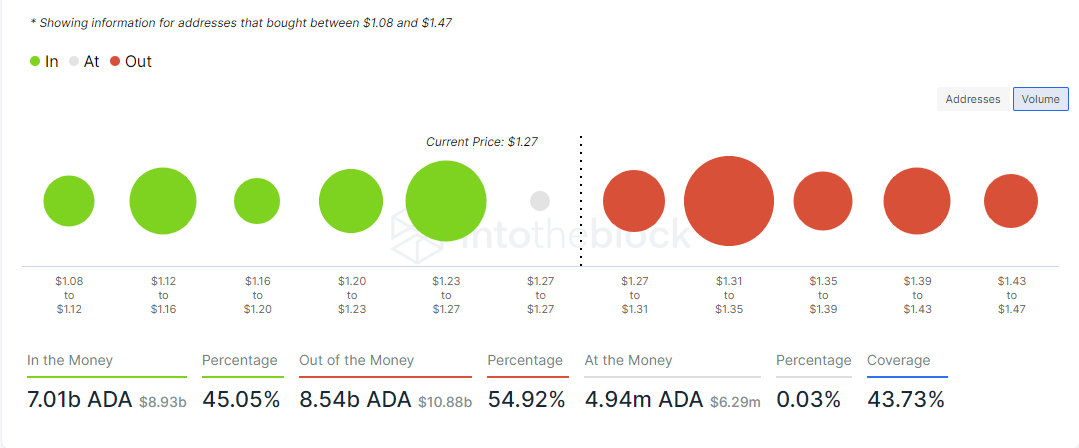
ADA IOMAP - IntoTheBlock
No recovery from a multi-month decline will be free of obstacles or bouts of selling pressure. Still, the bear trap suggests that the remaining weak holders have been removed, and Cardano price can engineer a sustainable rebound. Moreover, the ADA/BTC pair points to a new period of relative strength for the altcoin, perfect for overcoming the large layer of resistance around the 50-day SMA and marching beyond the 2018 high towards the measured move target at the psychologically important $2.00.
Here, FXStreet's analysts evaluate where ADA could be heading next as it seems bound for higher highs.
Author

Sheldon McIntyre, CMT
Independent Analyst
Sheldon has 24 years of investment experience holding various positions in companies based in the United States and Chile. His core competencies include BRIC and G-10 equity markets, swing and position trading and technical analysis.


