Three reasons SafeMoon price will more than double
- SafeMoon price broke out of a falling wedge pattern on August 6.
- Investors can expect a 13% upswing from the $0.00000163 support barrier.
- The SAFEMOON wallet and the upcoming developments might trigger the upswing.

SafeMoon price has been on a slow downtrend since its all-time high on May 12. However, the sell-off was exacerbated after May 19. Although SAFEMOON showed signs of reversal on August 4 and August 12, these signs were a fluke.
However, all is not lost as the support level at $0.00000163 is a major crucial barrier and could trigger a massive uptrend.
Bullish technicals and oversold conditions
SafeMoon price set up three lower highs and four lower lows since May 21. Connecting these swing points using trend lines shows the formation of a falling wedge pattern on the 12-hour chart.
This technical formation forecasts a 77% upswing, determined by measuring the distance between the first swing high and low. Adding this distance to the breakout point at $0.00000217 reveals an intended target at $0.00000378.
However, since its breakout on August 6, SAFEMOON price has failed to display bullish momentum and has crashed 25% from $0.00000217 to retest a crucial support barrier at $0.00000163, which served as a foothold on April 18, facilitating a 443% upswing in the next three days or less.
Therefore, investors can expect a bullish reaction after a retest of the $0.00000163 demand level.
Another reason for being bullish on SafeMoon price is the Relative Strength Index, which has slipped below the oversold zone at 30. A dip below 30 indicates that the investors have been booking profit, leading to a sell-off.
The last four times SAFEMOON hit this level, its market value saw a 25% to 55% upswing.
Combining this observation with the bullish falling wedge pattern, market participants can expect a continuation of the rally to its intended target at $0.00000378.
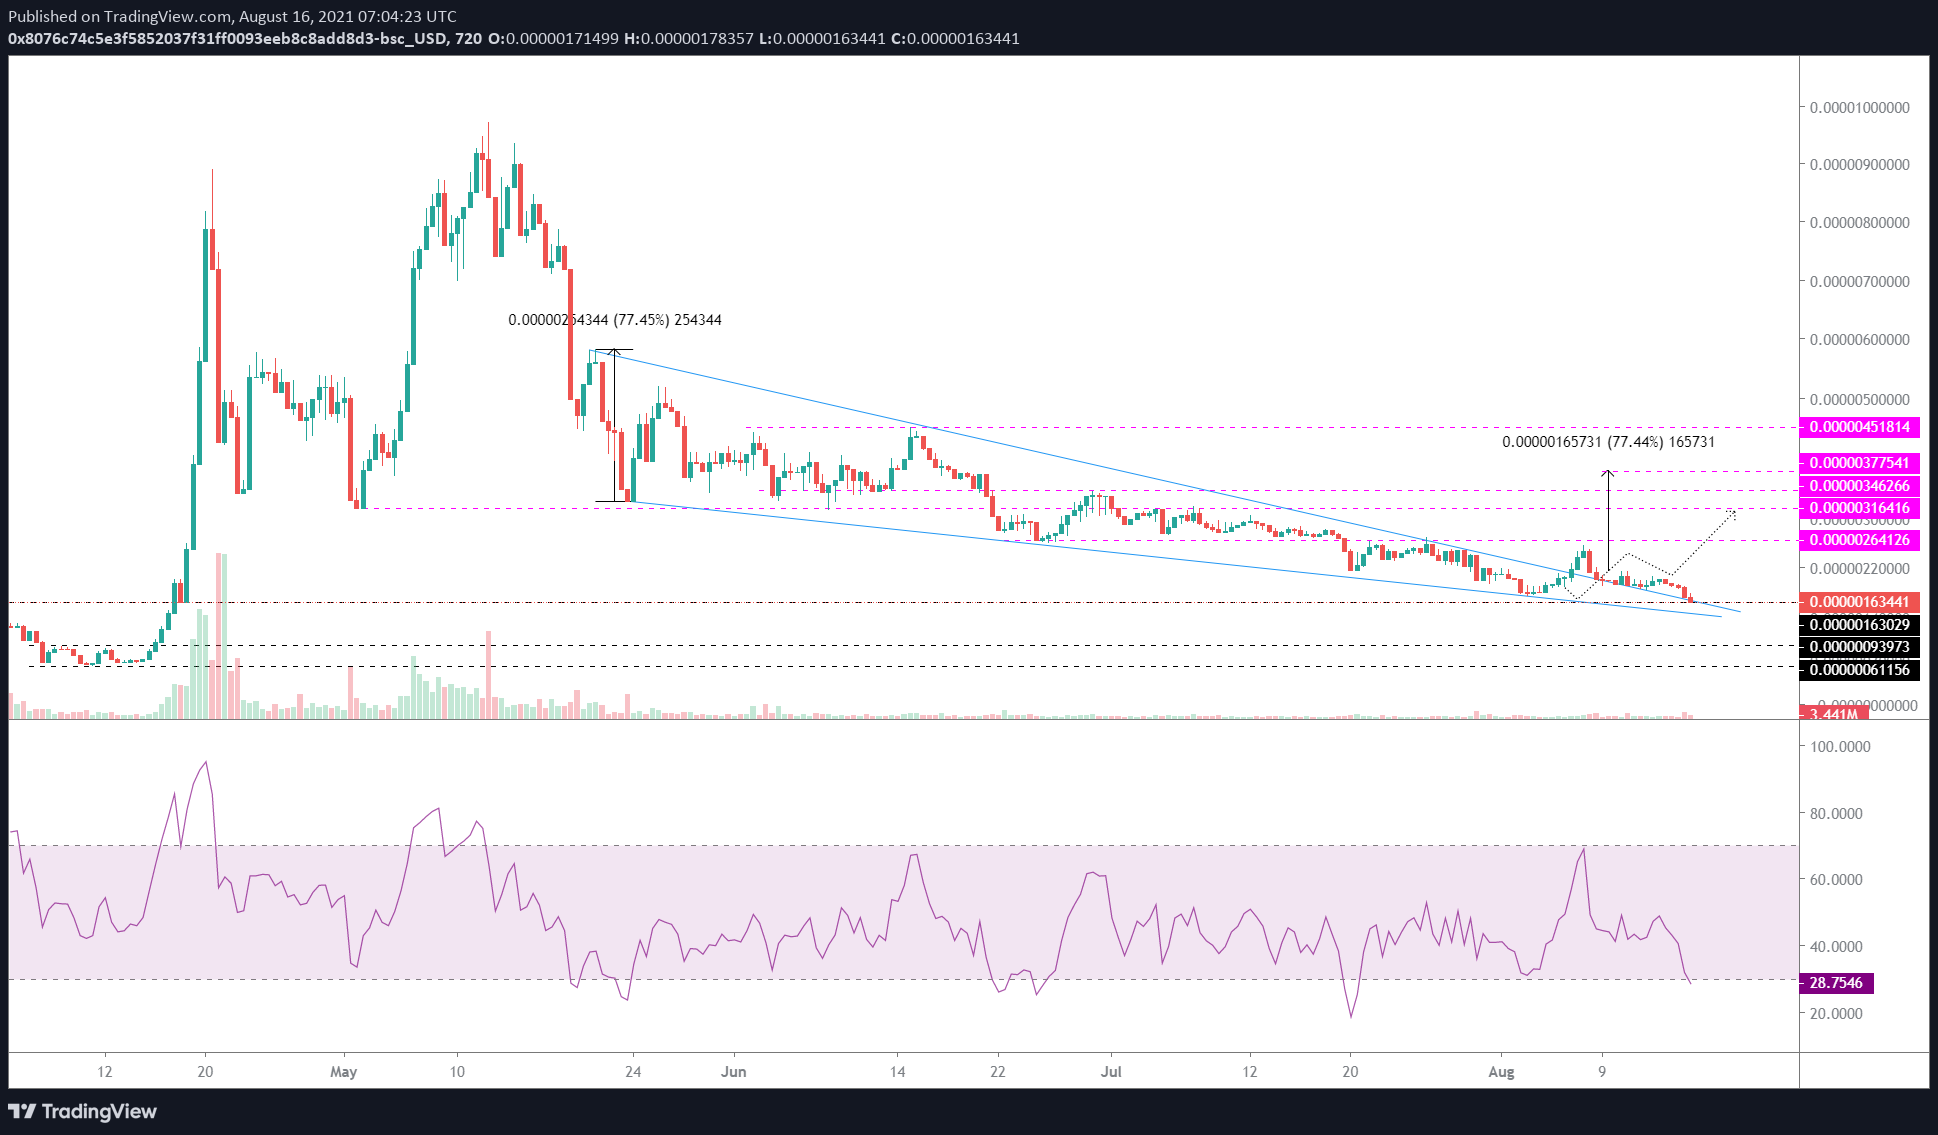
SAFEMOON/USDT 12-hour chart
SafeMoon wallet launch date announced
SafeMoon has been teasing its upcoming wallet for quite some time. However, it recently announced the launch date, August 28. This step comes after the company has kept things hush-hush surrounding the wallet. Moreover, the beta testing for the wallet, which is now closed, has made the developers sign an NDA (non-disclosure agreement).
This move has left the users searching for answers as they wait with bated breath. Investors can expect the launch of the wallet to have a positive impact on the SafeMoon price.
THANK YOU FOR ALL THE SUPPORT ON THE JOURNEY TO THE #SAFEMOONWALLET LAUNCH COMING SOON AUGUST 28TH pic.twitter.com/atarzOUuX7
— SafeMoon (@safemoon) August 14, 2021
On a similar note, other notable developments surrounding SAFEMOON include the bridge to WAX and EOS cryptocurrencies.
Typically, a bridge is a platform that offers cross-chain connection, i.e. transfer of data and assets across multiple blockchains. Although a definitive date has not been provided, a Twitter post suggests that this bridge will be launched in September.
To sum it up, these developments are likely to catalyze the already bullish technicals, propelling SAFEMOON to double in market value.
✨ #SAFEMOON KEY MOMENTS pic.twitter.com/2aUQXrWKES
— SafeMoon (@safemoon) August 8, 2021
Regardless of the bullish technicals and fundamental developments around SafeMoon, investors should note that $0.00000163 is a crucial demand barrier. A decisive 12-hour candlestick close below this area will invalidate the bullish thesis and signify weak buying pressure.
While SafeMoon price might consolidate in this area, a failure to hold around this barrier might potentially trigger a 45% downswing to $0.00000094 and $0.00000061.
Author

Akash Girimath
FXStreet
Akash Girimath is a Mechanical Engineer interested in the chaos of the financial markets. Trying to make sense of this convoluted yet fascinating space, he switched his engineering job to become a crypto reporter and analyst.


