- Algorand, Decentraland and JasmyCoin hovers around $0.19, $0.27, and $0.015 on Tuesday after a double-digit recovery last week.
- ALGO, MANA and JASMY approach their key resistance levels; breakout suggests a rally ahead.
- The technical outlook for these altcoins indicates a rally ahead as momentum indicators show bullish projections.
Algorand (ALGO), Decentraland (MANA), and JasmyCoin (JASMY) hovers around $0.19, $0.27, and $0.015 at the time of writing on Tuesday after a double-digit recovery last week. ALGO, MANA and JASMY approach their key resistance levels, while the technical outlook suggests a rally ahead as momentum indicators show bullish projections.
Algorand Price Forecast: ALGO bulls aim for $0.27 mark
Algorand price found support around the lower trendline of a falling wedge pattern (drawn by connecting multiple highs and lows with two trendlines from early December) and recovered 12.69% last week. On Monday, ALGO extended its gains by 3.36%. At the time of writing on Tuesday, it trades slightly above $0.19, approaching the 50-day Exponential Moving Average (EMA) at $0.20.
If ALGO breaks above the 50-day EMA and closes above its daily resistance level at $0.21, it would extend the rally to retest its weekly resistance level at $0.27.
The Relative Strength Index (RSI) on the daily chart reads 52, pointing upward above its neutral level of 50, indicating an increase in bullish momentum. The Moving Average Convergence Divergence (MACD) indicator also showed a bullish crossover last week, giving a buy signal and indicating an upward trend. It also shows a rising histogram above its neutral zero level, suggesting bullish momentum.
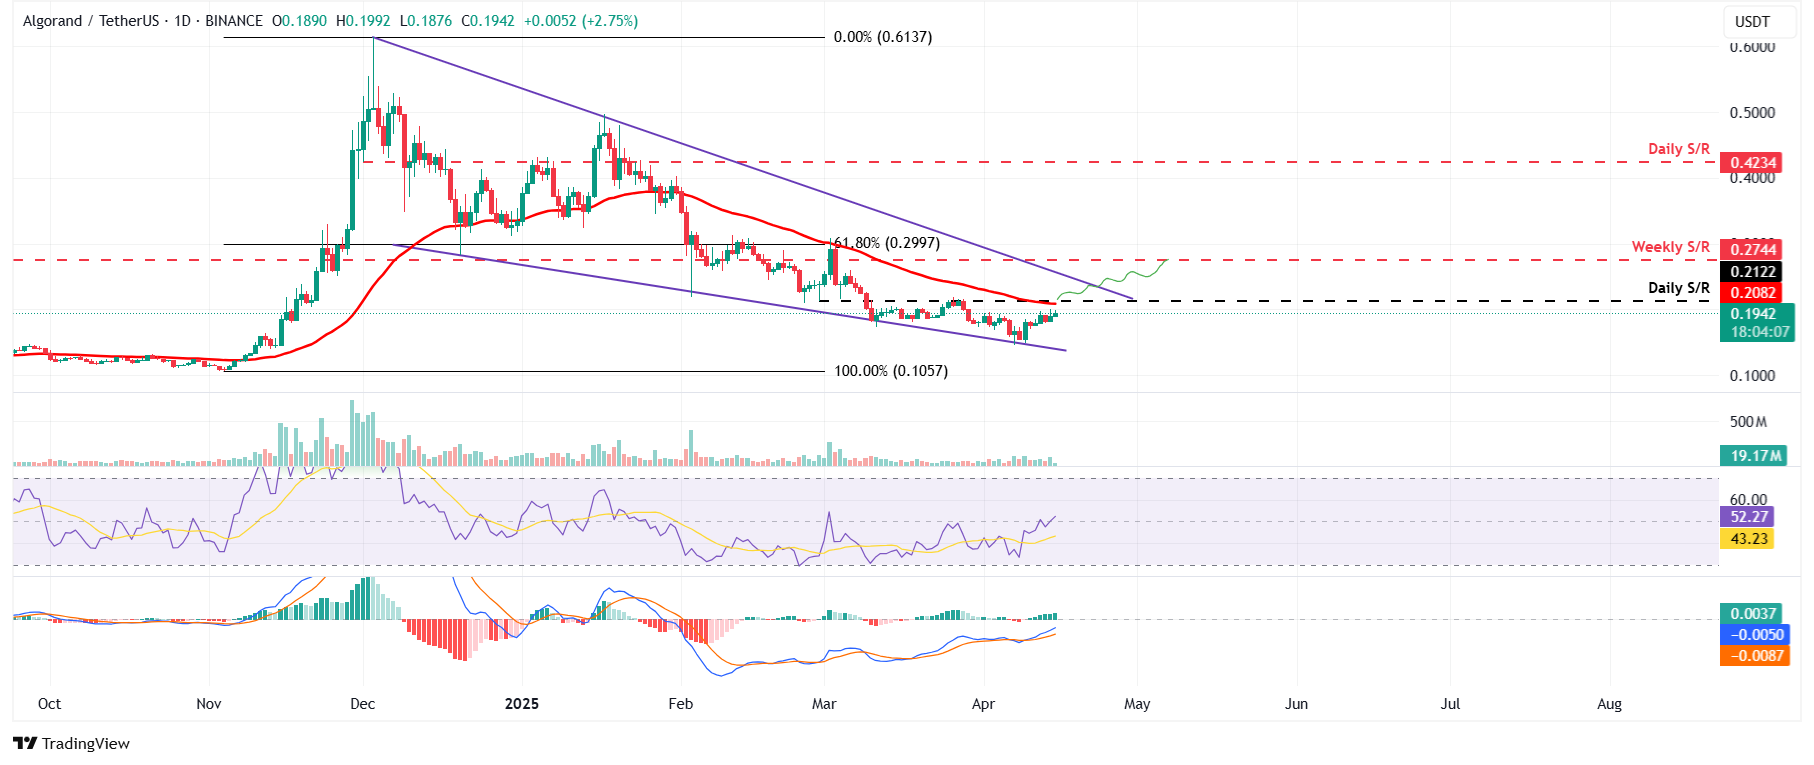
ALGO/USDT daily chart
Coinglass’s long-to-short ratio data for Algorand reads 1.15, the highest level over a month. This ratio above one reflects bullish sentiment in the markets as more traders are betting for the asset price to rise.
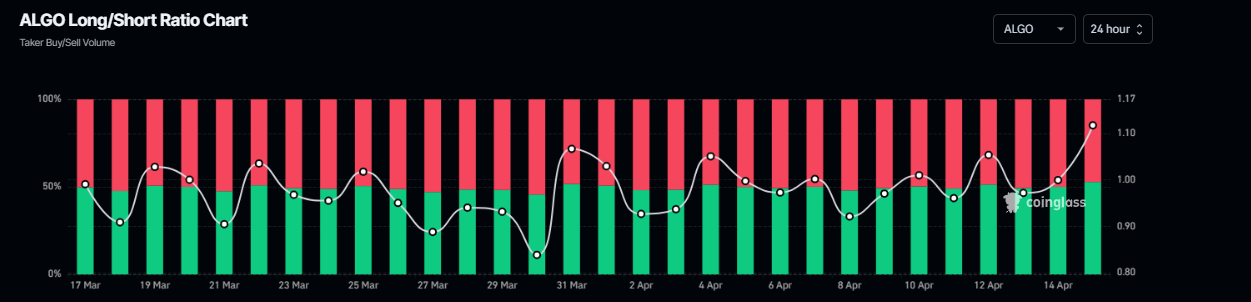
ALGO long-to-short ratio chart. Source: Coinglass
Decentraland Price Forecast: MANA could rally if it closes above $0.28
Decentraland price broke above the descending trendline (drawn by joining multiple highs since mid-February) on Saturday, retested and found support the next day, and rose nearly 3% on Monday. At the time of writing on Tuesday, it trades slightly down, facing resistance from the 50-day EMA at $0.27.
If MANA breaks above the 50-day EMA and closes above its weekly resistance level at $0.28, it would extend the rally to retest the 50% Fibonacci retracement (drawn from the January 31 high of $0.46 to the April 7 low of $0.19) at $0.32.
The RSI on the daily chart reads 55, indicating bullish momentum. The MACD indicator also showed a bullish crossover last week, giving a buy signal and indicating an upward trend. It also shows a rising histogram above its neutral zero level, suggesting bullish momentum.
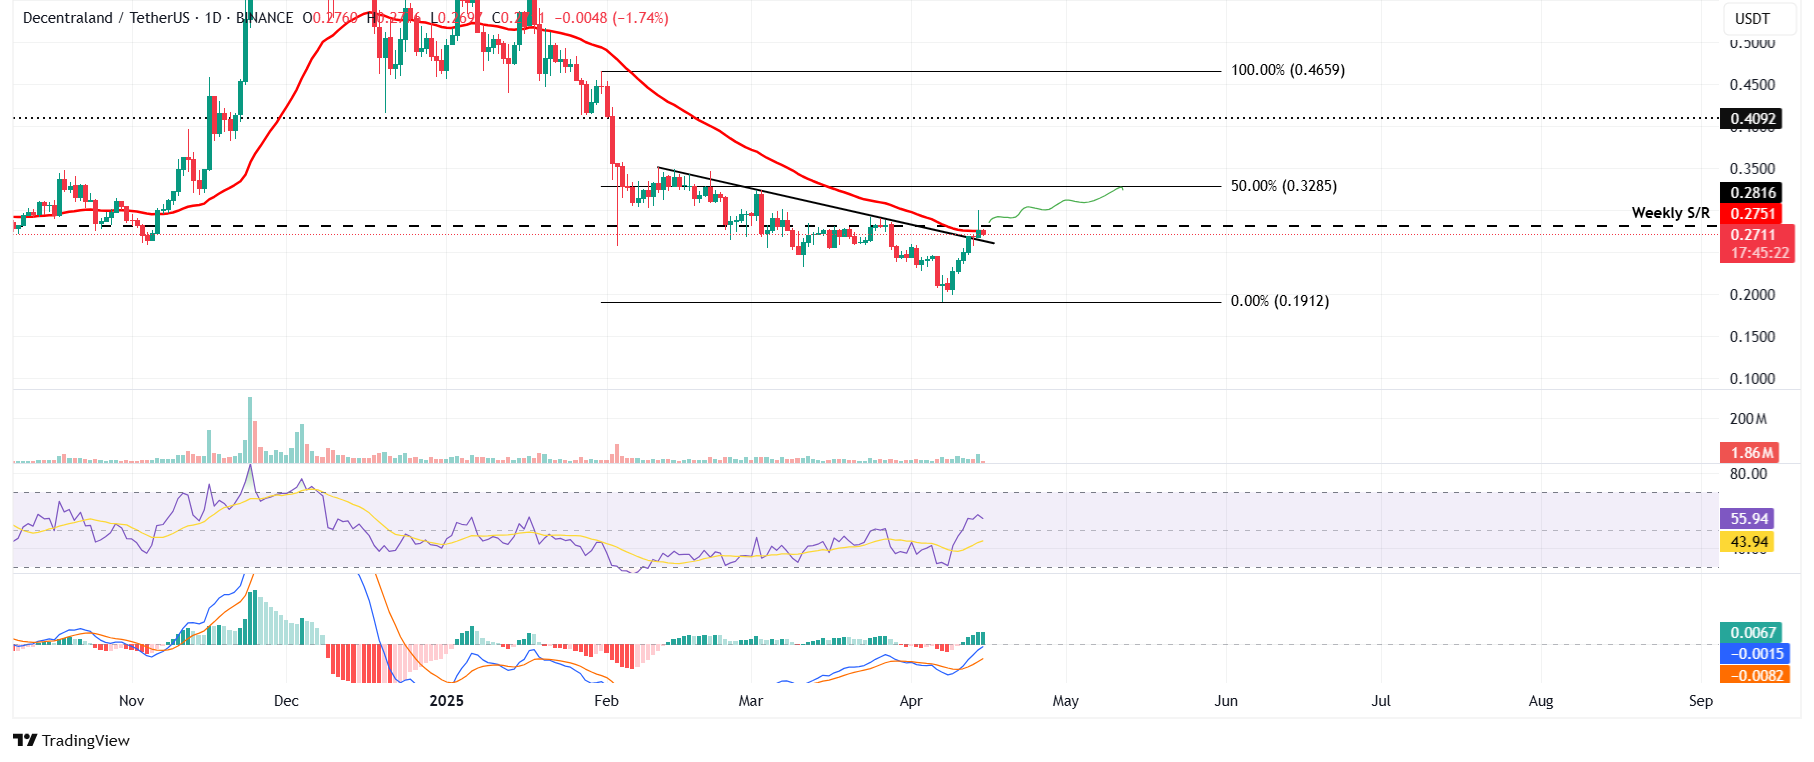
MANA/USDT daily chart
Santiment’s Supply Distribution metric shows that the whales holding between 100,000 and 1 million MANA tokens dropped from 123.69 million on April 3 to 123.02 on Tuesday. Meanwhile, wallets holding 1 million, 10 million and 10 million to 100 million surged from 622.76 million to 641.70 million and 504.46 million to 603.61 million, respectively, in the same period.
This development shows that the first cohort of whales could have fallen prey to the capitulation event. In contrast, the second set of wallets seized the opportunity and accumulated Decentraland at a discount during the recent price dip, bolstering investors’ confidence in MANA.
 [10-1744702311836.53.44, 15 Apr, 2025].png)
MANA Supply Distribution chart. Source: Santiment
JasmyCoin Price Forecast: JASMY remains strong if $0.015 is maintained
JasmyCoin price broke above the descending trendline (drawn by joining multiple highs since mid-December) and closed above the 50-day EMA at $0.014 on Saturday. However, JASMY found rejection around its weekly level of $0.017 the next day and declined slightly. At the time of writing on Tuesday, it continues its decline, approaching its daily support level of $0.015.
If the daily support level at $0.015 holds and JASMY recovers to close above $0.017, it could extend the rally to retest its March 2 high of $0.020.
The RSI on the daily chart reads 60, indicating bullish momentum. The MACD indicator also showed a bullish crossover last week, giving a buy signal and indicating an upward trend. It also shows a rising histogram above its neutral zero level, suggesting bullish momentum.
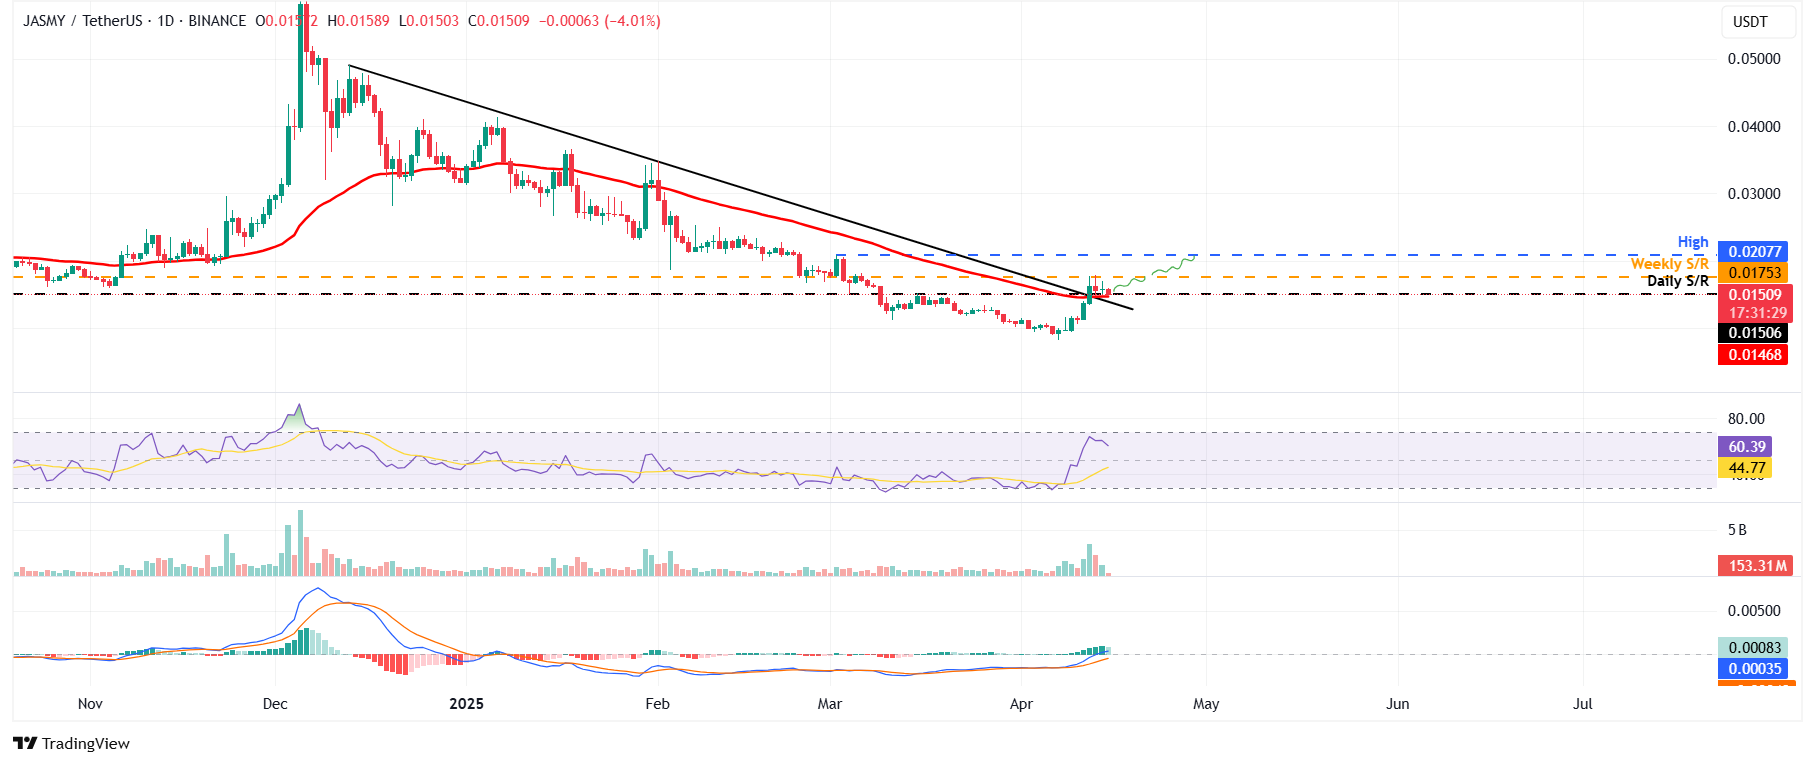
JASMY/USDT daily chart
JasmyCoin's Open Interest (OI) further supports the bullish outlook. Coinglass’s data shows that the futures’ OI in JASMY at exchanges rose from $22.14 million on Friday to $50.15 million on Sunday, the highest level since early February. An increasing OI represents new or additional money entering the market and new buying, which suggests a rally ahead in the JASMY price.
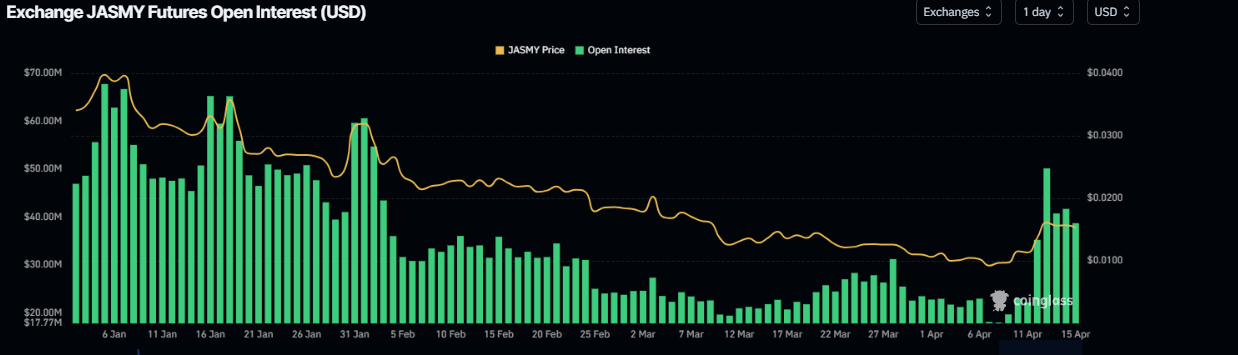
JASMY open interest chart. Source: Coinglass
Information on these pages contains forward-looking statements that involve risks and uncertainties. Markets and instruments profiled on this page are for informational purposes only and should not in any way come across as a recommendation to buy or sell in these assets. You should do your own thorough research before making any investment decisions. FXStreet does not in any way guarantee that this information is free from mistakes, errors, or material misstatements. It also does not guarantee that this information is of a timely nature. Investing in Open Markets involves a great deal of risk, including the loss of all or a portion of your investment, as well as emotional distress. All risks, losses and costs associated with investing, including total loss of principal, are your responsibility. The views and opinions expressed in this article are those of the authors and do not necessarily reflect the official policy or position of FXStreet nor its advertisers. The author will not be held responsible for information that is found at the end of links posted on this page.
If not otherwise explicitly mentioned in the body of the article, at the time of writing, the author has no position in any stock mentioned in this article and no business relationship with any company mentioned. The author has not received compensation for writing this article, other than from FXStreet.
FXStreet and the author do not provide personalized recommendations. The author makes no representations as to the accuracy, completeness, or suitability of this information. FXStreet and the author will not be liable for any errors, omissions or any losses, injuries or damages arising from this information and its display or use. Errors and omissions excepted.
The author and FXStreet are not registered investment advisors and nothing in this article is intended to be investment advice.
Recommended Content
Editors’ Picks

Shiba Inu eyes positive returns in April as SHIB price inches towards $0.000015
Shiba Inu's on-chain metrics reveal robust adoption, as addresses with balances surge to 1.4 million. Shiba Inu's returns stand at a solid 14.4% so far in April, poised to snap a three-month bearish trend from earlier this year.

AI tokens TAO, FET, AI16Z surge despite NVIDIA excluding crypto-related projects from its Inception program
AI tokens, including Bittensor and Artificial Superintelligence Alliance, climbed this week, with ai16z still extending gains at the time of writing on Friday. The uptick in prices of AI tokens reflects a broader bullish sentiment across the cryptocurrency market.

Bitcoin Weekly Forecast: BTC consolidates after posting over 10% weekly surge
Bitcoin price is consolidating around $94,000 at the time of writing on Friday, holding onto the recent 10% increase seen earlier this week. This week’s rally was supported by strong institutional demand, as US spot ETFs recorded a total inflow of $2.68 billion until Thursday.

XRP price could renew 25% breakout bid on surging institutional and retail adoption
Ripple price consolidates, trading at $2.18 at the time of writing on Friday, following mid-week gains to $2.30. The rejection from this weekly high led to the price of XRP dropping to the previous day’s low at $2.11, followed by a minor reversal.
Bitcoin Weekly Forecast: BTC consolidates after posting over 10% weekly surge
Bitcoin (BTC) price is consolidating around $94,000 at the time of writing on Friday, holding onto the recent 10% increase seen earlier this week.

The Best brokers to trade EUR/USD
SPONSORED Discover the top brokers for trading EUR/USD in 2025. Our list features brokers with competitive spreads, fast execution, and powerful platforms. Whether you're a beginner or an expert, find the right partner to navigate the dynamic Forex market.