This is how low Bitcoin can go
- Bitcoin price shows clear signs of bearish continuation.
- Another 40% to 50% drop is increasingly probable.
- Upside potential is limited in size and scope.

Bitcoin price continues to display substantial weakness, with further threats to the downside now in site.
Bitcoin price approaches new 17-month lows
Bitcoin price barely holds on to the $29,000 value area as support. $29,000 is where the 2021 lows, 61.8% Fibonacci retracement, and the bottom of the final high volume node in the 2022 Volume Profile currently exist.
BTC previously dropped below this zone during the flash crash on May 12, 2022. While there was some hope and evidence that a broader bullish reversal could occur, buyers were unable or unwilling to support Bitcoin price any higher.
Below $29,000 is a wide-open range that Bitcoin price could fall into. The primary support levels are as follows:
$23,000 – contains the 78.6% Fibonacci retracement at $23,300, the 100% Fibonacci expansion at $23,000, and a high volume node in the 2020 Volume Profile.
$15,000 – contains a high volume node in the 2020 Volume Profile at $15,300 and the 161.8% Fibonacci expansion at $14,500.
$9,000 to $11,000 – contains the 2020 Volume Point of Control at $9,300, 200% Fibonacci expansion at $11,000, and the top of the monthly Ichimoku Cloud at $10,300.
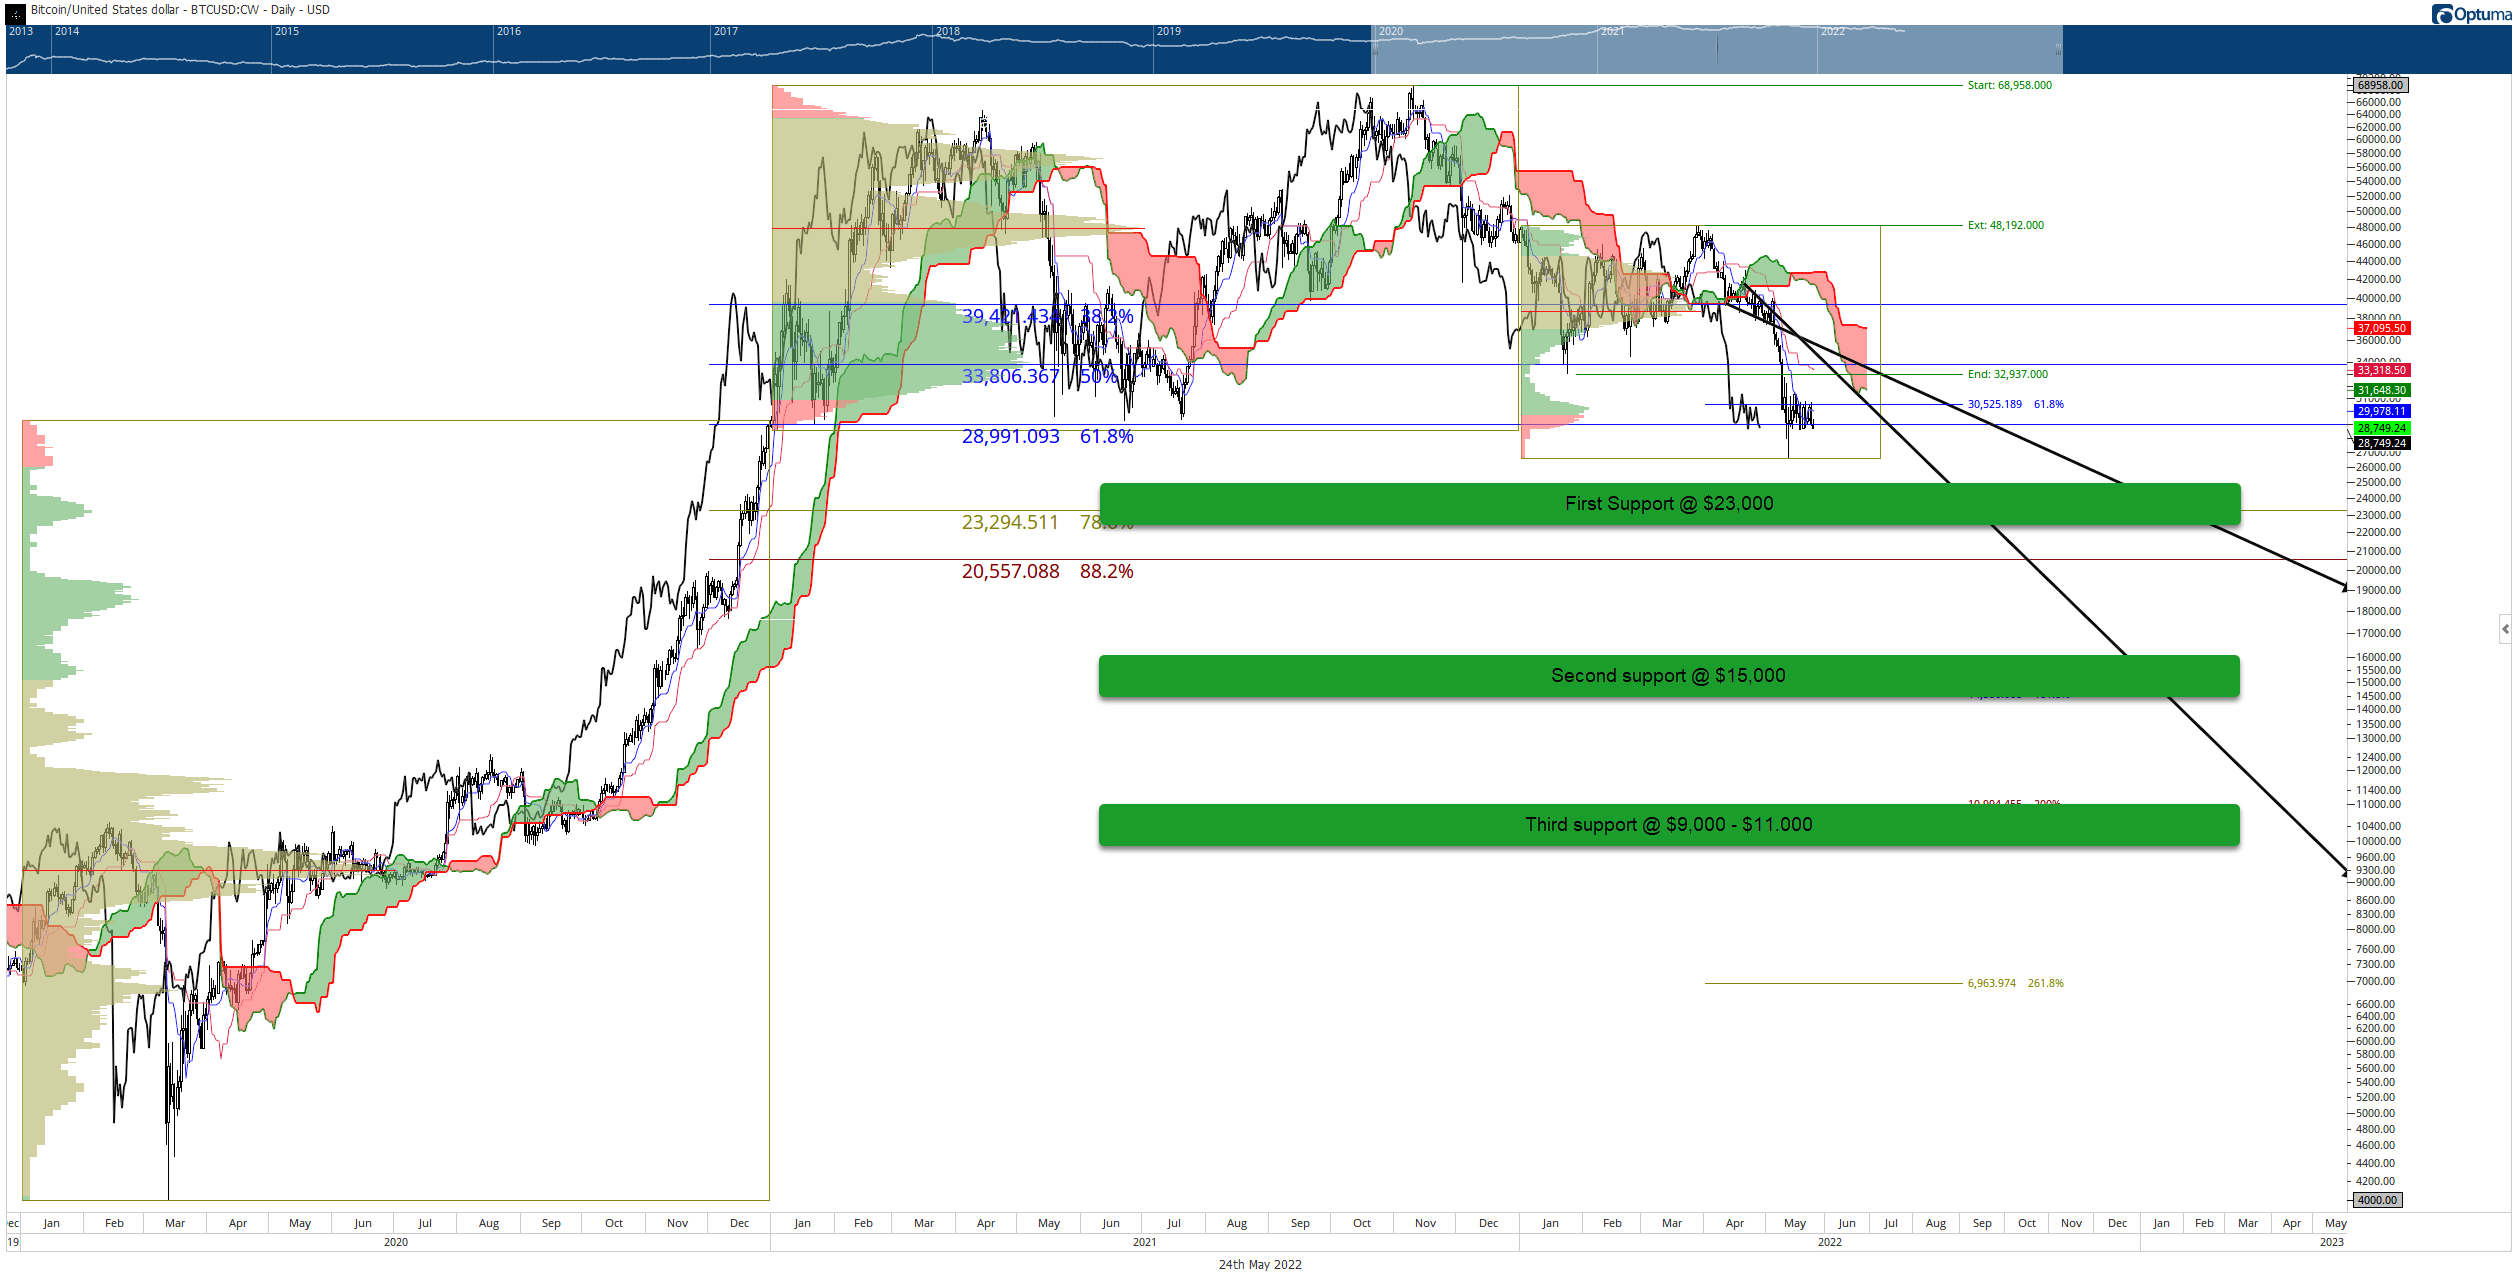
BTC/USD Daily Ichimoku Kinko Hyo Chart
For bulls, there are two reasons why an upswing should be expected. First, Bitcoin price is within the 180-day Gann Cycle of the Inner Year, which indicates a bullish bounce is highly probable. Second, measuring from the previous all-time high peak in April 2021 shows more than 400 days have passed. This is important because Bitcoin’s corrective moves often culminate within the 400 to 450-day range.
Any upside potential is likely to be limited to the 50% Fibonacci retracement and Kijun-Sen in the $34,000 value area.
Author

Jonathan Morgan
Independent Analyst
Jonathan has been working as an Independent future, forex, and cryptocurrency trader and analyst for 8 years. He also has been writing for the past 5 years.


