This Ethereum price level is preventing ETH from breaking out
- Ethereum price continues to make successive moves higher over the weekend, creating a new three-month higher on Saturday.
- Dip buying continues, but bullish conviction is tested against the $3,500 price level.
- A 12% pullback is likely if bulls fail to close above $3,500.

Ethereum price action is at an inflection point. All eyes are on Ethereum to see how it reacts to the $3,500 level this week. Failure to close above could likely result in a swift return to $3,000 or even lower to the $2,500 level. But success would likely mean new all-time highs are just around the corner.
Ethereum price must break and close above $3,500
Ethereum price faces a tough resistance zone at $3,500, which is the level preventing ETH from moving higher. $3,500 contains the 100% Fibonacci expansion and the weekly Kijun-Sen, resulting in an exceptionally powerful resistance area. However, above $3,500, wide-open skies and a total lack of any Ichimoku resistance levels are ahead, with only the 161.8% Fibonacci retracement at $4,550 as the final Fibonacci level before new all-time highs are reached.
From an oscillator perspective, a push above $3,500 seems inevitable for Ethereum price. The Relative Strength Index just crossed above the first oversold level in a bull market (50) after trading in between the oversold level of 40 and 50 since the beginning of 2022. The Optex Bands remain in neutral conditions and don’t show any overbought or oversold concerns – but the Optex Bands have only recently turned up from the all-time lows.
Perhaps the most bearish warning signal between the candlestick chart and the Composite Index could be one of the most bullish triggers: the hidden bearish divergence now present. Hidden bearish divergence is a warning that the current upswing is likely to terminate and the prior downtrend will continue. If Ethereum shows a strong close above $3,500, it will likely invalidate the hidden bullish divergence, generating a major bear trap for short-sellers.
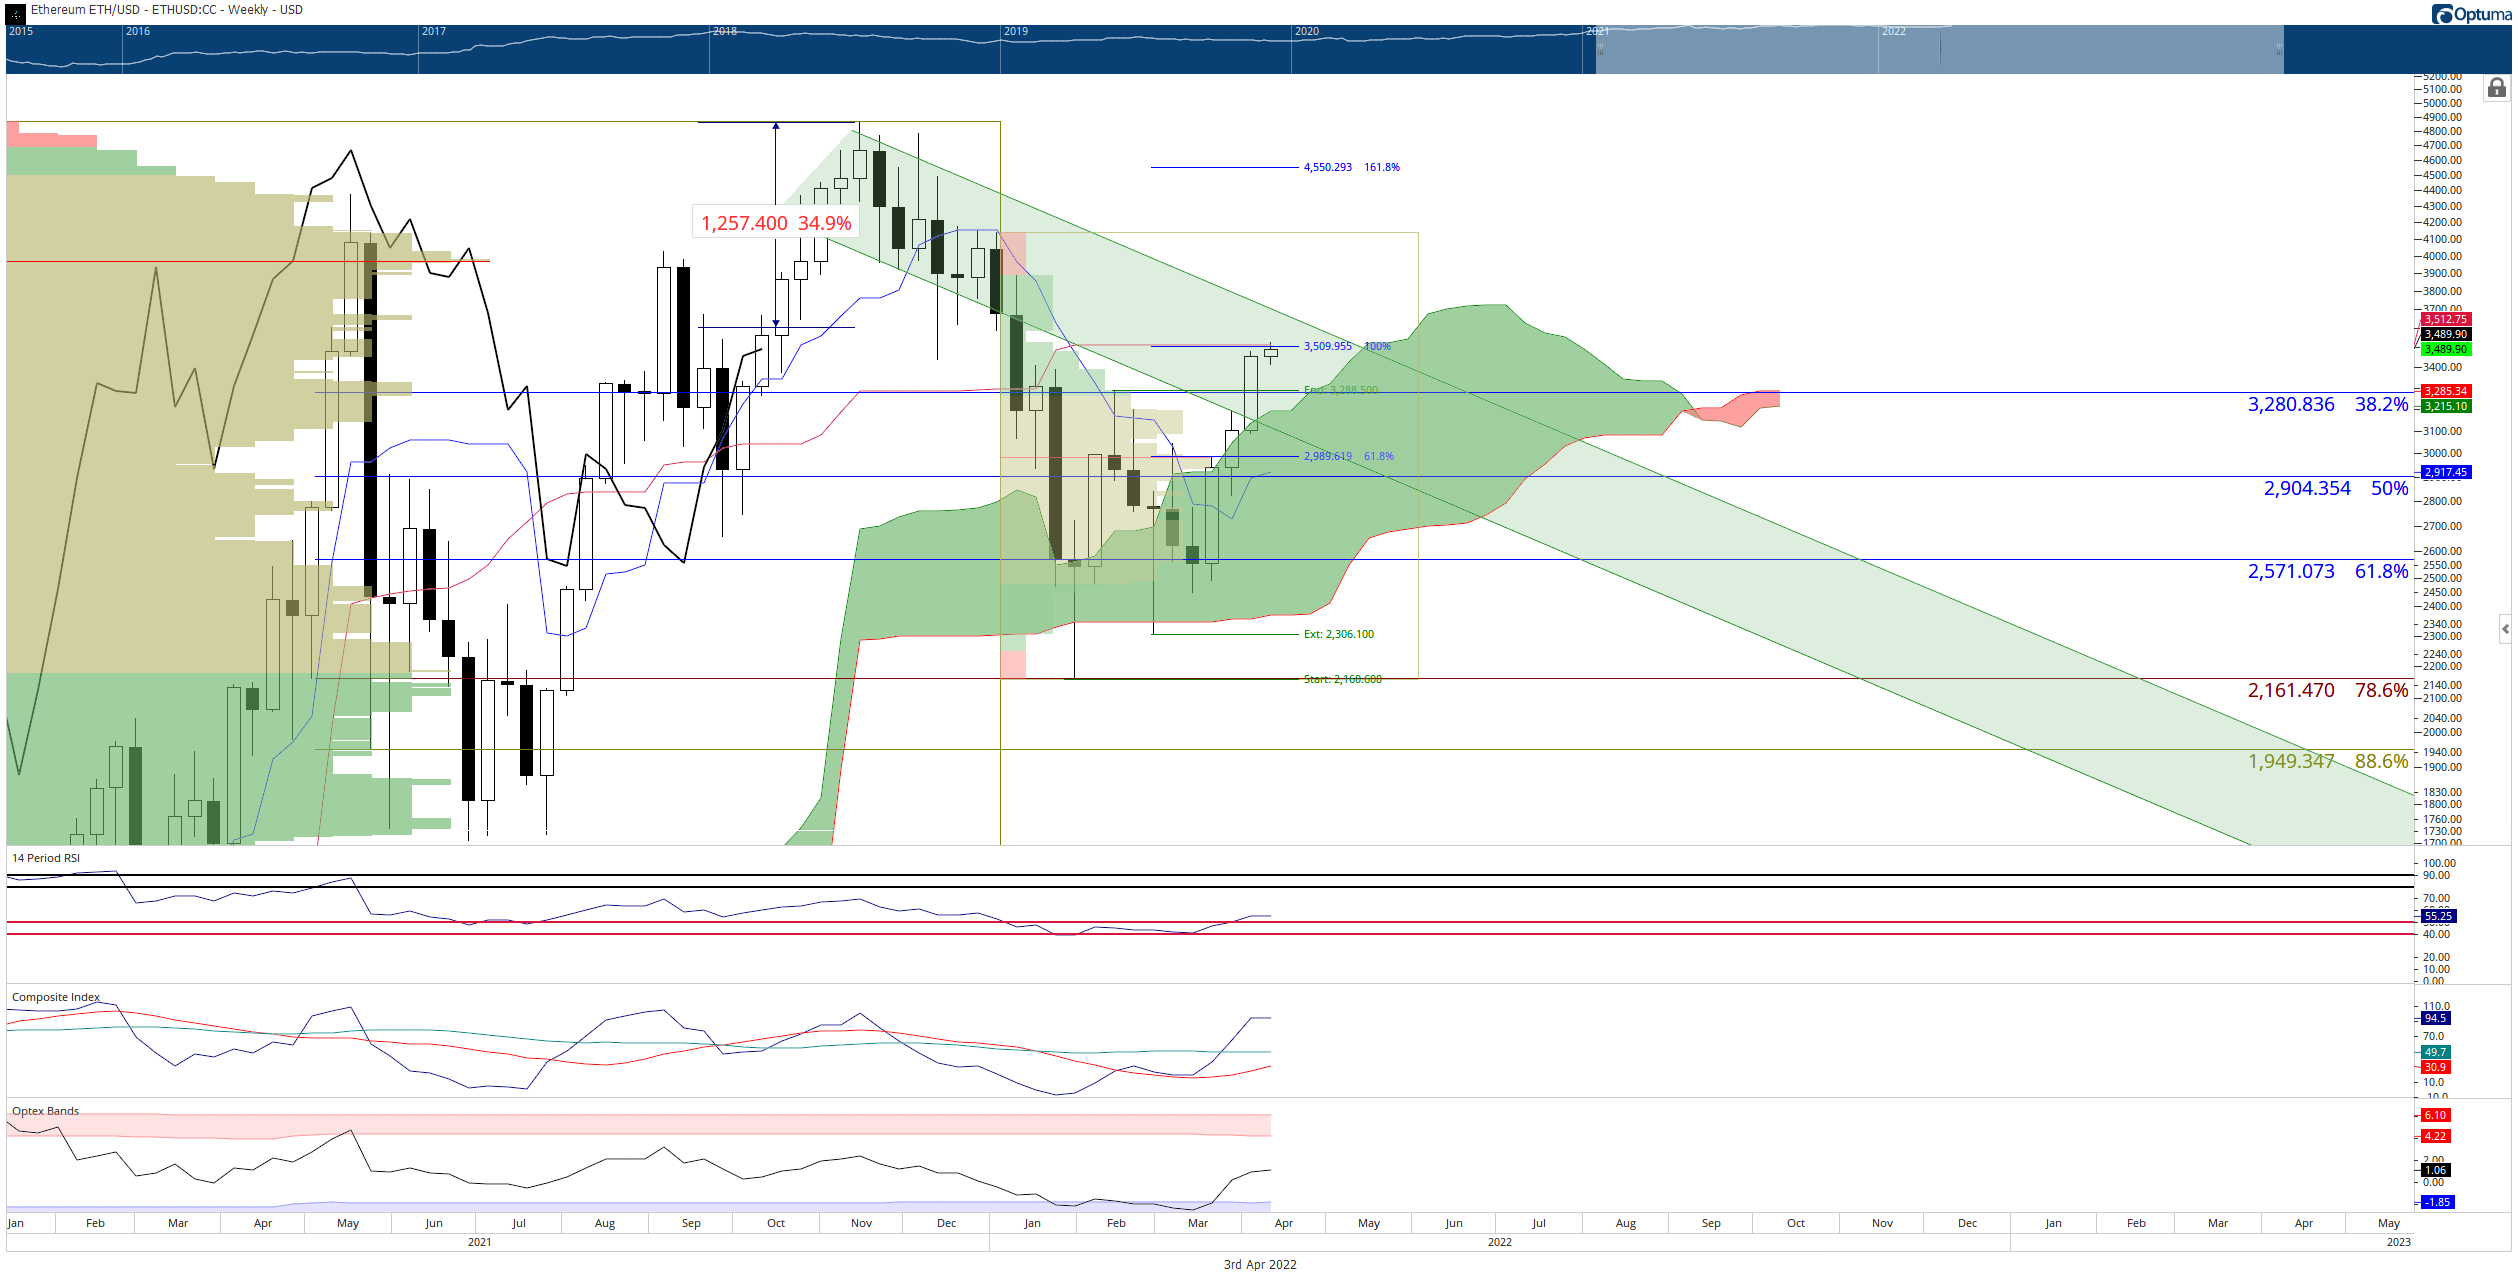
ETH/USD Weekly Ichimoku Kinko Hyo Chart
Downside risks, however, are a concern – especially if bulls fail to push Ethereum price above $3,500. There are several support structures below that may halt any major sell-off. The closest cluster of support zones at the $3,000 value area where the 50% Fibonacci retracement, weekly Tenkan-Sen, the 2022 Volume Point Of Control, and prior 61.8% Fibonacci expansion current exist.
However, below $3,000, the next major support level doesn’t appear until the bottom of the Ichimoku Cloud (Senkou Span B) at $2,370.
Author

Jonathan Morgan
Independent Analyst
Jonathan has been working as an Independent future, forex, and cryptocurrency trader and analyst for 8 years. He also has been writing for the past 5 years.


