Theta Price Prediction: THETA primed for another potential downswing
- Theta price has been rejected twice at $9.636, coinciding with the 62% Fibonacci retracement level.
- While THETA might pierce the said level or beyond it, a rejection here seems likely.
- A decisive close below 50% the Fibonacci retracement level at $8.504 will signal the downtrend’s start.

Theta price has seen confined moves as it recuperates from losses experienced after the crash on May 19. As THETA approaches a critical resistance level, another rejection seems likely. A consolidation might evolve here due to the presence of a demand zone.
Theta price to experience range-bound moves
Theta price rallies seem to be capped by the 62% and 70.5% Fibonacci retracement levels at $9.636 and $10.429, respectively. The three attempts to surpass these barriers have failed, and the latest rejection led to a 24% downswing into a demand zone, extending from $7.341 to $7.809.
A resurgence of buying pressure from this point propelled THETA up by roughly 28% over the past two days. However, the bullish momentum was exhausted before tagging the 62% Fibonacci retracement level at $9.636.
A similar turn of events might trigger a 16% crash in Theta price to the said demand zone. If the selling pressure continues to build up, THETA might decline 12% to tag the next support area, ranging from $5.909 to $6.838.
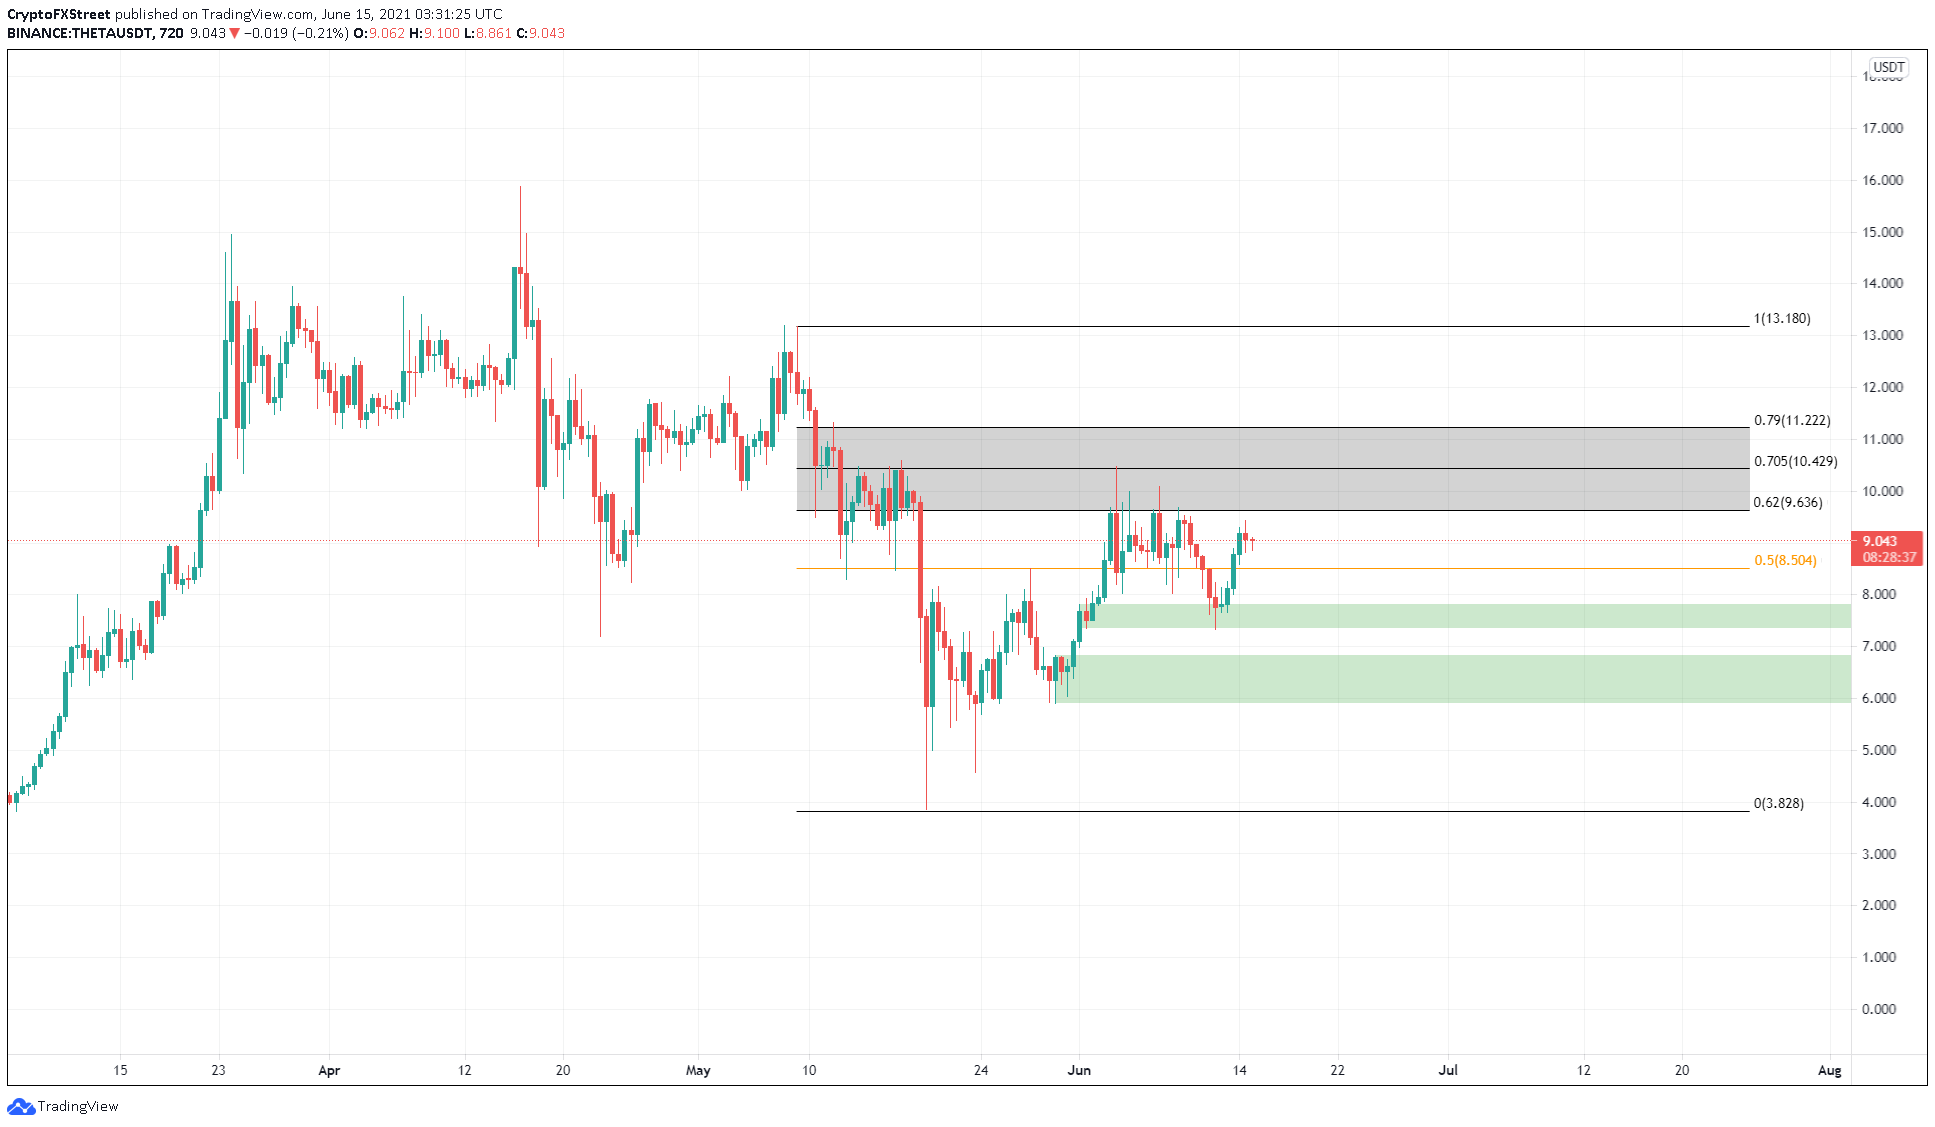
THETA/USDT 12-hour chart
On the flip side, if Theta price produces a close above the 62% or 70.5% Fibonacci retracement levels at $9.636 and $10.429, respectively, it will signal the presence of buyers.
However, a decisive close above the 79% Fibonacci retracement level at $11.222 might open the possibility of an uptrend.
If this were to happen, THETA might experience a minor pullback, which could set the stage for the start of a new upswing. In such a case, the range high at $13.18 will be the most likely target for bulls.
Author

Akash Girimath
FXStreet
Akash Girimath is a Mechanical Engineer interested in the chaos of the financial markets. Trying to make sense of this convoluted yet fascinating space, he switched his engineering job to become a crypto reporter and analyst.


