![]() Rajarshi Mitra
Rajarshi Mitra
Independent Analyst
- THETA flashed the sell signal in the TD sequential in its 12-hour chart.
- THETA had a bullish breakout from the cup and handle pattern in the daily chart.
THETA flew up from $0.55 to $0.64 over the course of the day, reaching all-time high levels. However, the monthly chart has started flashing a sell sign.
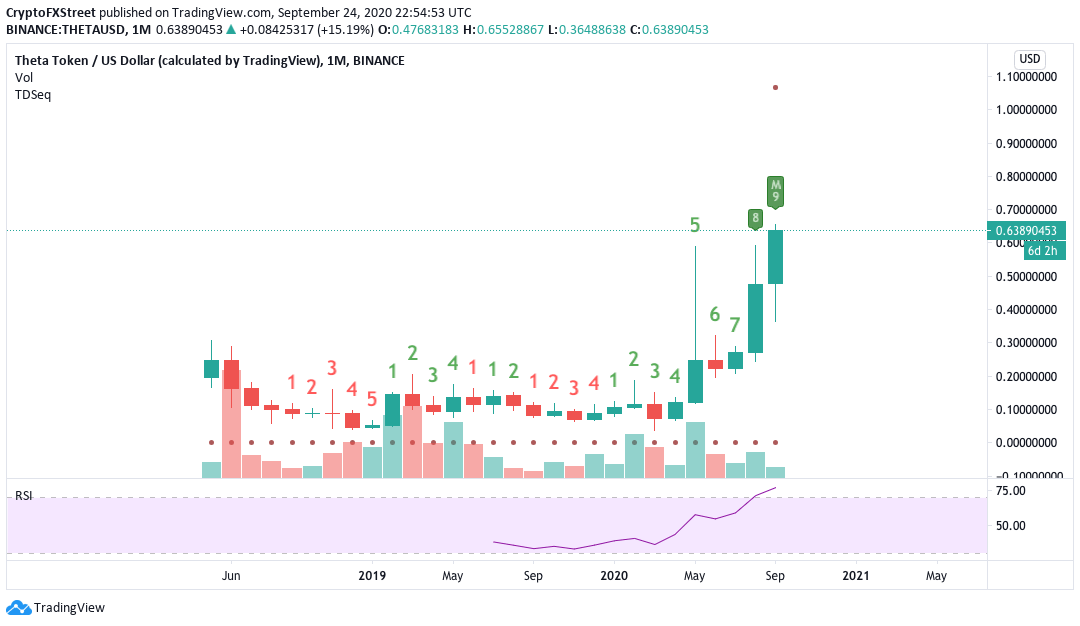
Along with the TD sequential, the relative strength index (RSI) in the monthly chart has crept into the overbought zone, showing that the asset is currently overvalued. So, are we going to see a reversal here? Let’s check out some of the other charts.
THETA/USD daily chart
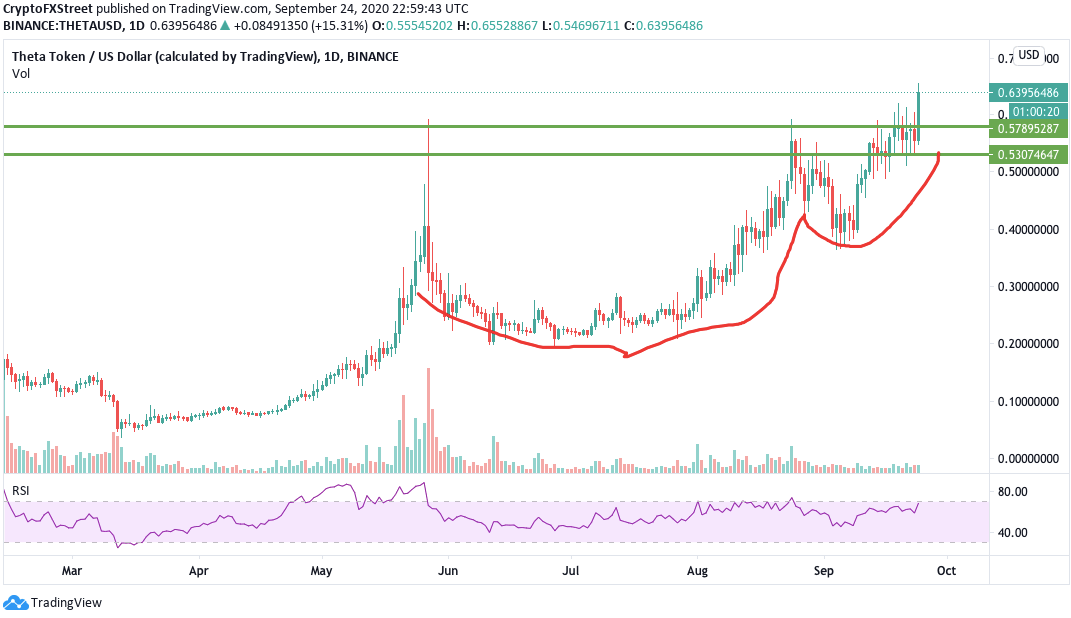
The daily chart has charted a cup and handle pattern, from which the buyers enjoyed a bullish breakout. However, the RSI is trending on the verge of the overbought zone as the price looks to open the doors for short-term bearish correction. To see how much the correction will be, let’s check the IOMAP.
THETA IOMAP
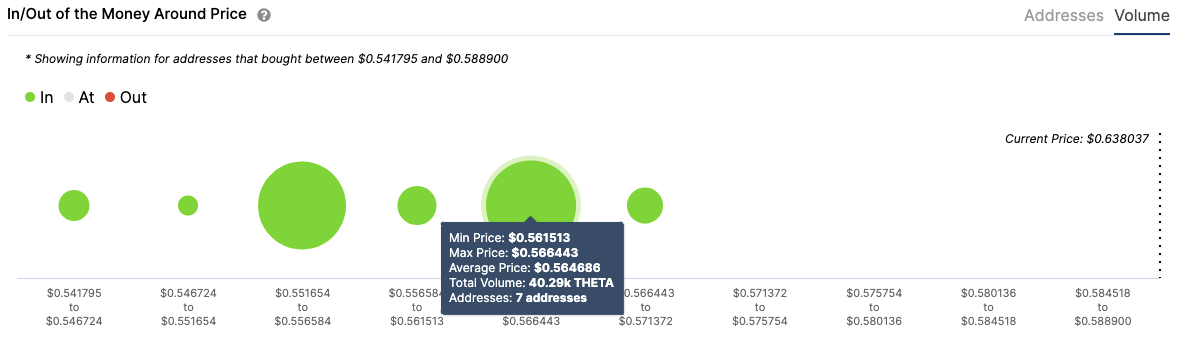
IntoTheBlock’s “In/Out of the Money Around Price” (IOMAP) model estimates that $0.564 plays a crucial role in THETA’s trend. Transaction history shows that this is the largest supply barrier underneath THETA. Previously, seven addresses had bought 40.29k THETA. On the upside, the price lacks healthy resistance levels since its currently in all-time high positions.
So, if the price does drop, it will fall till $0.564, where the healthy support wall should be able to absorb the selling pressure. However, if the bears turn out to be more relentless, the price has space to drop till $0.5545, before it encounters another healthy support level.
THETA 12-hour chart
-637365868813831010.png)
The THETA 12-hour chart shows that the MACD market momentum has reversed from bearish to bullish. However, the price has jumped above the 20-day Bollinger Band, which again indicates that the asset is presently overvalued and should face bearish correction. There is a mixture of different technical indicators, giving us a host of various clues as to what to expect next.
Verdict
So, what can we expect the price to do?
Different signs show us that we will see some short-term bearish correction as of now. Various indicators tell us that THETA is presently overvalued in these current levels. However, as you know, it's impossible to predict these things with 100% certainty. Cryptocurrencies are, after all, heavily governed by speculation. So, if the bulls do retain control, the IOMAP tells us that there is quite a lot of space growth as THETA hovers into hitherto uncharted territory.
Note: All information on this page is subject to change. The use of this website constitutes acceptance of our user agreement. Please read our privacy policy and legal disclaimer. Opinions expressed at FXstreet.com are those of the individual authors and do not necessarily represent the opinion of FXstreet.com or its management. Risk Disclosure: Trading foreign exchange on margin carries a high level of risk, and may not be suitable for all investors. The high degree of leverage can work against you as well as for you. Before deciding to invest in foreign exchange you should carefully consider your investment objectives, level of experience, and risk appetite. The possibility exists that you could sustain a loss of some or all of your initial investment and therefore you should not invest money that you cannot afford to lose. You should be aware of all the risks associated with foreign exchange trading, and seek advice from an independent financial advisor if you have any doubts.
Recommended Content
Editors’ Picks

Bitcoin Weekly Forecast: BTC nosedives below $95,000 as spot ETFs record highest daily outflow since launch
Bitcoin price continues to edge down, trading below $95,000 on Friday after declining more than 9% this week. Bitcoin US spot ETFs recorded the highest single-day outflow on Thursday since their launch in January.

Bitcoin crashes to $96,000, altcoins bleed: Top trades for sidelined buyers
Bitcoin (BTC) slipped under the $100,000 milestone and touched the $96,000 level briefly on Friday, a sharp decline that has also hit hard prices of other altcoins and particularly meme coins.

Solana Price Forecast: SOL’s technical outlook and on-chain metrics hint at a double-digit correction
Solana (SOL) price trades in red below $194 on Friday after declining more than 13% this week. The recent downturn has led to $38 million in total liquidations, with over $33 million coming from long positions.

SEC approves Hashdex and Franklin Templeton's combined Bitcoin and Ethereum crypto index ETFs
The SEC approved Hashdex's proposal for a crypto index ETF. The ETF currently features Bitcoin and Ethereum, with possible additions in the future. The agency also approved Franklin Templeton's amendment to its Cboe BZX for a crypto index ETF.

Bitcoin: 2025 outlook brightens on expectations of US pro-crypto policy
Bitcoin (BTC) price has surged more than 140% in 2024, reaching the $100K milestone in early December. The rally was driven by the launch of Bitcoin Spot Exchange Traded Funds (ETFs) in January and the reduced supply following the fourth halving event in April.

Best Forex Brokers with Low Spreads
VERIFIED Low spreads are crucial for reducing trading costs. Explore top Forex brokers offering competitive spreads and high leverage. Compare options for EUR/USD, GBP/USD, USD/JPY, and Gold.