These two DeFi tokens are primed to skyrocket
- SushiSwap price continues to trade in a horizontal channel, but waning selling pressure has positioned SUSHI for an immediate breakout.
- Aave price emerging from an ascending triangle pattern, breaking the 200-day simple moving average (SMA) resistance.
- DeFi Pulse Index is releasing from an ascending triangle pattern with a measured move of over 40%.

SushiSwap price is positioned to activate a horizontal channel pattern as the 50-day SMA has shifted from resistance to support near the upper line of the pattern. Aave price mimics DeFi Pulse Index and emerges from an ascending triangle pattern as it uncovers a strong bid, carrying it over 10% today.
DeFi Pulse Index confirms accumulation off the lows
The DeFi Pulse Index is a digital asset index designed to track tokens’ performance within the decentralized finance industry. The index is capitalization-weighted and seeks to track the projects in decentralized finance that have significant usage and show a commitment to ongoing maintenance and development.
The index began in September 2020 and consisted of the most popular DeFi tokens available on Ethereum, including COMP, YFI and MKR, thereby allowing investors to buy a single ERC-20 token that provides exposure to all ten tokens.
On a technical basis, the DeFi Pulse Index collapsed 70% from the May high of $662.43 to the June low of $197.46, largely erasing the 2021 gains. However, the index shaped an ascending triangle pattern over the last two months and is currently breaking out with a measured move of over 40% and a price target of almost $500.
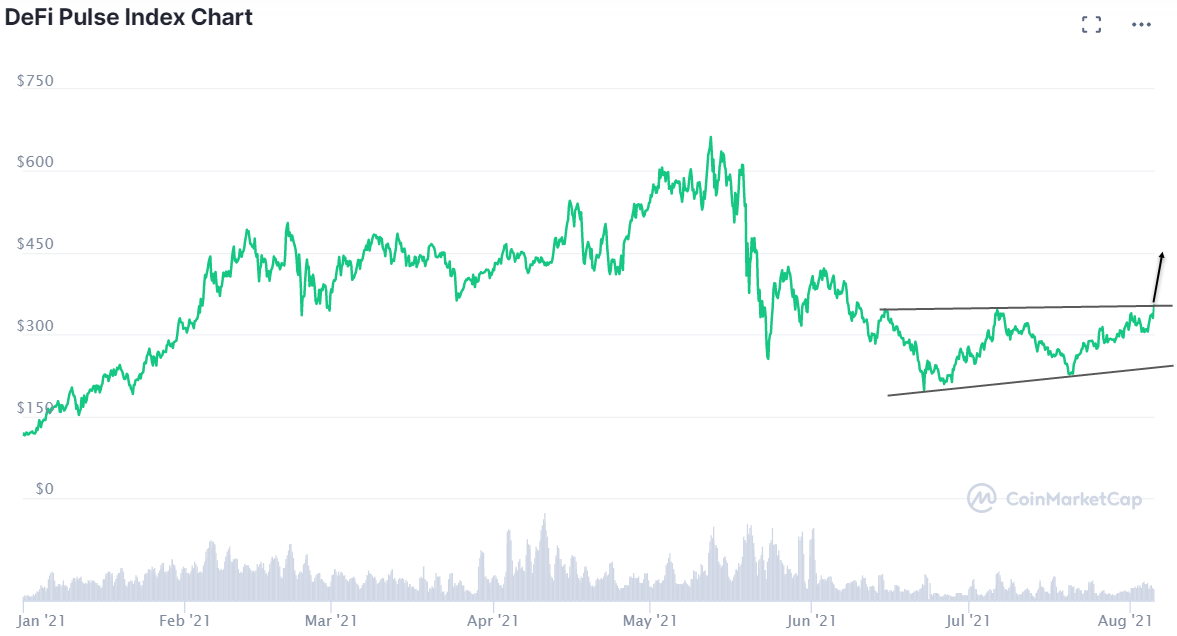
DeFi Pulse Index YTD chart
Ascending triangles are categorized as a bullish formation that usually forms during an uptrend as a continuation pattern. Still, there are examples like the DeFi Pulse Index that form as reversal patterns at the end of a downtrend. The ascending triangle pattern, whether as a continuation or trend reversal pattern, indicates accumulation as the reaction lows continue to rise.
With the resolution of the ascending triangle pattern, the DeFi Pulse Index confirms the accumulation along the lows and communicates better outcomes for the space.
SushiSwap price hints at an upside breakout
SushiSwap price closed last week up 1.73% and with a gain of 8.66% for July, keeping the DeFi token locked in the horizontal channel that has governed SUSHI since mid-June.
To identify a potential breakout for a horizontal channel, it is recommended to wait for a rebound or decline that fails to cover the whole range. It will indicate that buying or selling pressure has been exhausted, and the digital token is ready to release from the pattern.
After hitting the upper line of the horizontal channel on July 26, SushiSwap price has corrected, but only down to the 50-day SMA, currently at $7.76, creating a minor, rising trend line that suggests that SUSHI selling pressure has been exhausted.
A SushiSwap price close above $9.85 would confirm the breakout and propel SUSHI to the 200-day SMA at $12.56. The measured move of the horizontal channel is 40%, projecting a SUSHI price target of $13.82. SushiSwap price will need to break through the 38.2% Fibonacci retracement of the March-June correction at $13.07 to reach the measured move target.
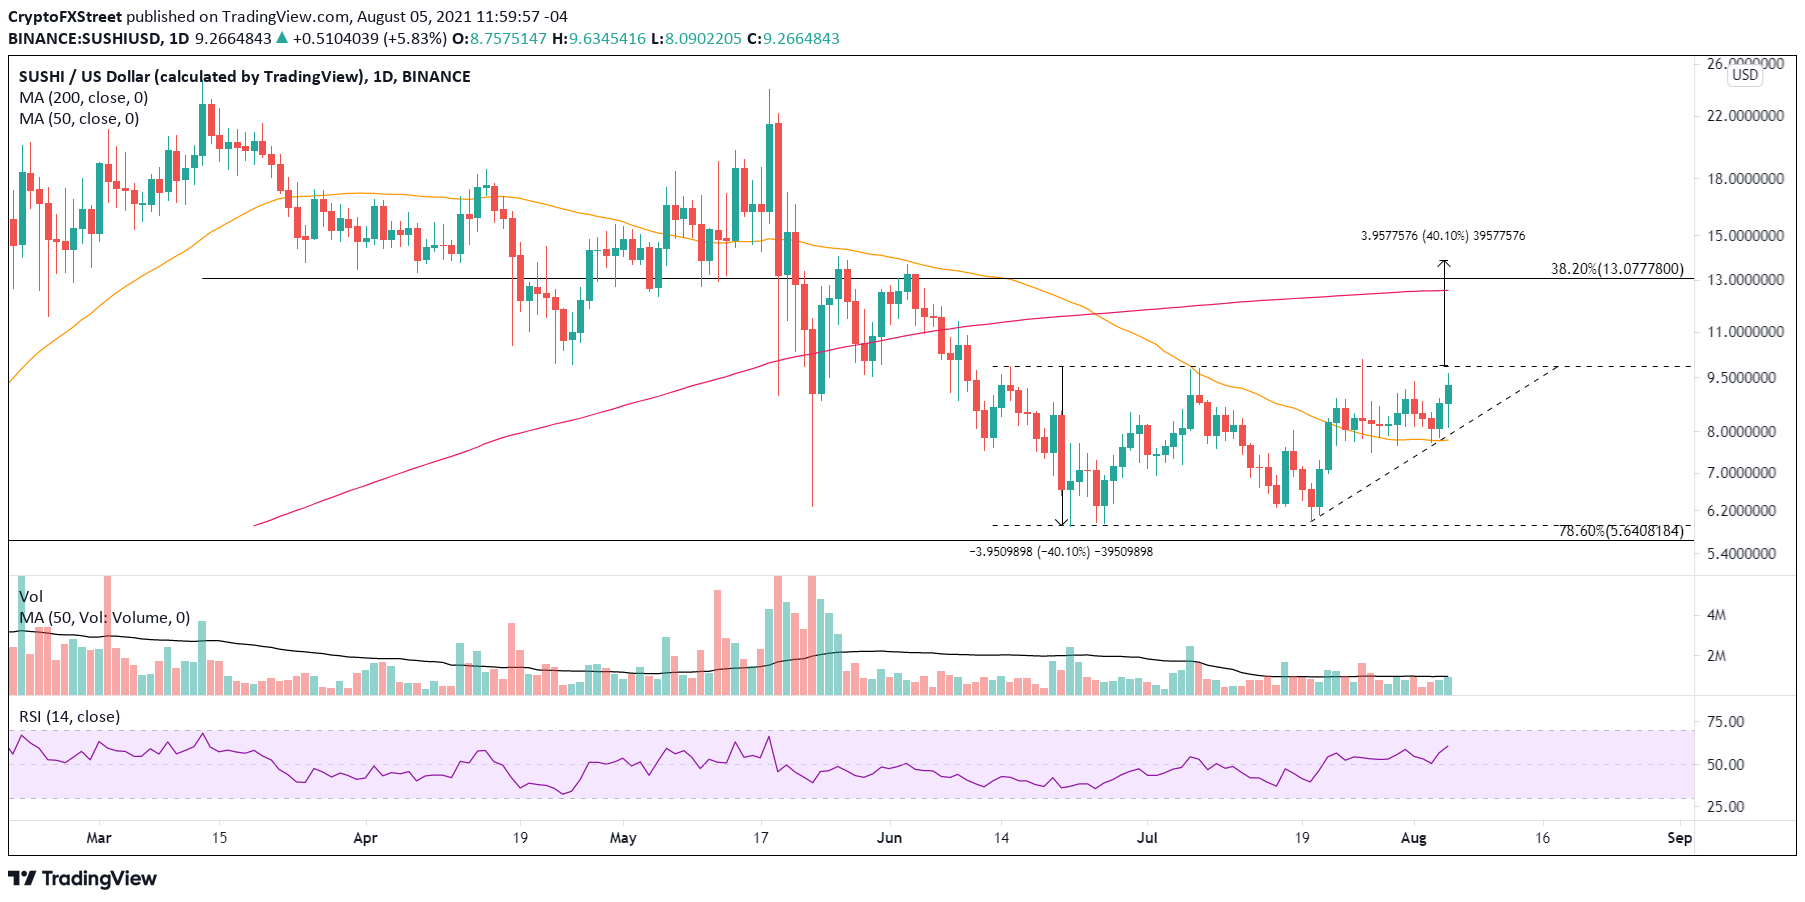
SUSHI/USD daily chart
The developing bullish scenario would be voided with a daily close below the 50-day SMA at $7.76. It would project another test of the lower line of the SUSHI channel at $7.69 or the 78.6% retracement of the November-March advance at $5.64.
Aave price seeks a 50% return from bullish pattern
Aave price closed last week up 9.83% and recorded a 32.09% gain for July, outperforming most cryptocurrencies during the month.
Like the DeFi Pulse Index, Aave price has formed an ascending triangle pattern that resolved to the upside today with a breakout above the horizontal line of $348.26. The AAVE breakout faces notable technical obstacles, including the 200-day SMA at $357.78, the 38.2% retracement level of the May-June correction at $372.33 and a range of price congestion from late May and early June.
The ideal scenario for Aave price today is a daily close above the 38.2% retracement level. It would sever the magnet effect of the triangle’s horizontal line and the 200-day SMA and leave AAVE on track to test the 50% retracement level of $436.20, representing a gain of over 25%.
The measured move of the ascending triangle pattern is 52.61%, dictating an Aave price target of $531.20.
It must be noted that the AAVE daily Relative Strength Index (RSI) is nearing an overbought reading, favoring a rally to the 50% retracement before some form of Aave price consolidation or correction.
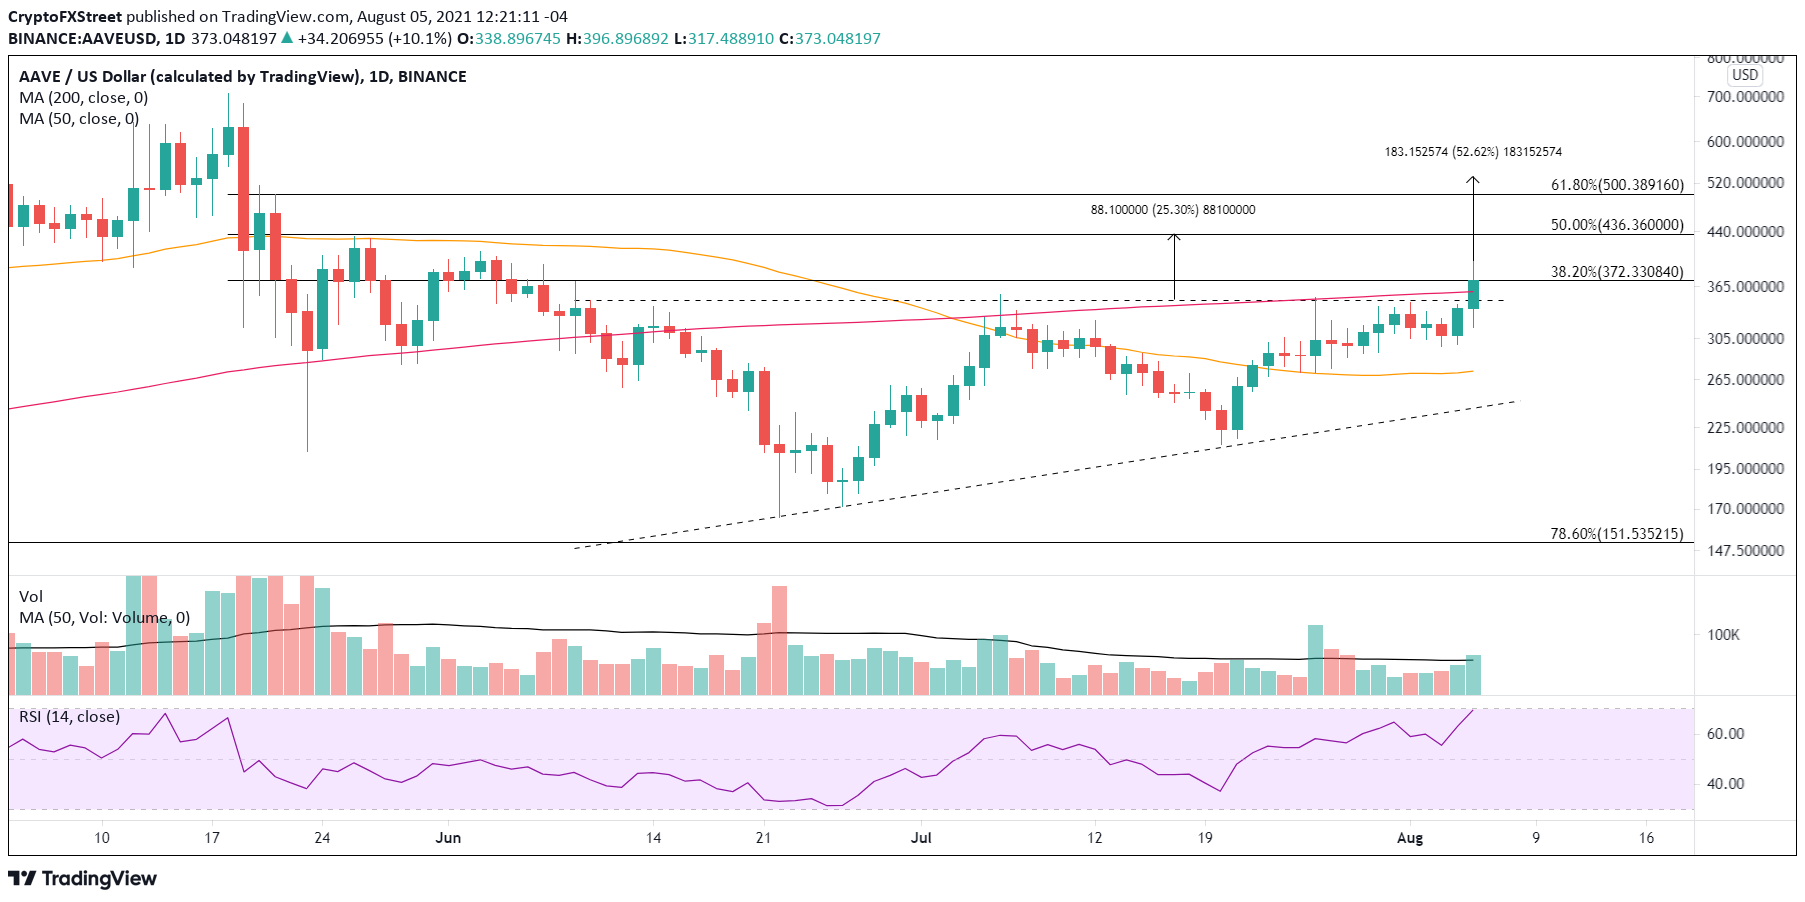
AAVE/USD daily chart
An Aave price throwback is a possibility following the confirmed AAVE breakout. Still, it should not fall very deep into the triangle, or it will signal a failure and a retest of the triangle’s rising trend line.
With a general momentum building in the DeFi space, there is a high probability opportunity to target digital DeFi tokens in a timely position for purchase. SUSHI and AAVE are two distinct opportunities in constructive patterns with clear entry prices that present significant measured moves ranging from 40-50%.
Author

Sheldon McIntyre, CMT
Independent Analyst
Sheldon has 24 years of investment experience holding various positions in companies based in the United States and Chile. His core competencies include BRIC and G-10 equity markets, swing and position trading and technical analysis.


