- Solana price has shown excellent resilience during the recent drawdown, making it a strong contender to reach new all-time highs.
- Chainlink price shows little to no recovery, but one particular on-chain metric favors a quick comeback.
- Icon price structure and the MRI suggest a massive rally ahead of it.
Bitcoin price has been down in the dumps with multiple failed attempts to escape the ranging market. Most altcoins promptly follow the flagship crypto, but Solana, Chainlink and Litecoin have a different plan and might recover quicker than the rest to hit new all-time highs.
Solana price leads by example
From a technical perspective, Solana price has set up four higher highs and four higher lows since May 18. Connecting trend lines from these swing points shows that SOL is consolidating in a symmetrical triangle pattern.
This technical formation contains two converging trend lines, suggesting that a massive breakout is likely.
SOL is currently attempting to break through the upper boundary, which will occur if the bulls produce a decisive daily candlestick close above $35.47.
This move would set up a higher high and end the 42-day downtrend, signaling to sidelined investors to jump on the bandwagon.
After this, Solana price has to clear a critical resistance barrier at $42.53. If this were to happen, it would open up the path to the current all-time high at $58.39. If the second phase of the bull run kick-starts, SOL could easily shatter $58.39 and scale to $173, coinciding with the 127.2% Fibonacci extension level.
Supporting this quick bullish thesis is the relative recovery of Solana compared to BTC and ETH. Throughout the bull run, Solana price showed massive run-ups, leading to huge returns. Even after the boom cycle seemingly ended, SOL price was shockingly resilient.
Since its all-time high at $58.39 on May 18, the market value of Solana has dropped roughly 67% and has recovered nearly 80% from the bottom.
Judged separately, these metrics might not sound impressive or help the case for Solana price, but BTC’s recovery from its bottom is only 20%, while ETH’s is 26%.
Going forward, investors can expect Solana price to continue its swift recovery, especially if it slices through $35.47.
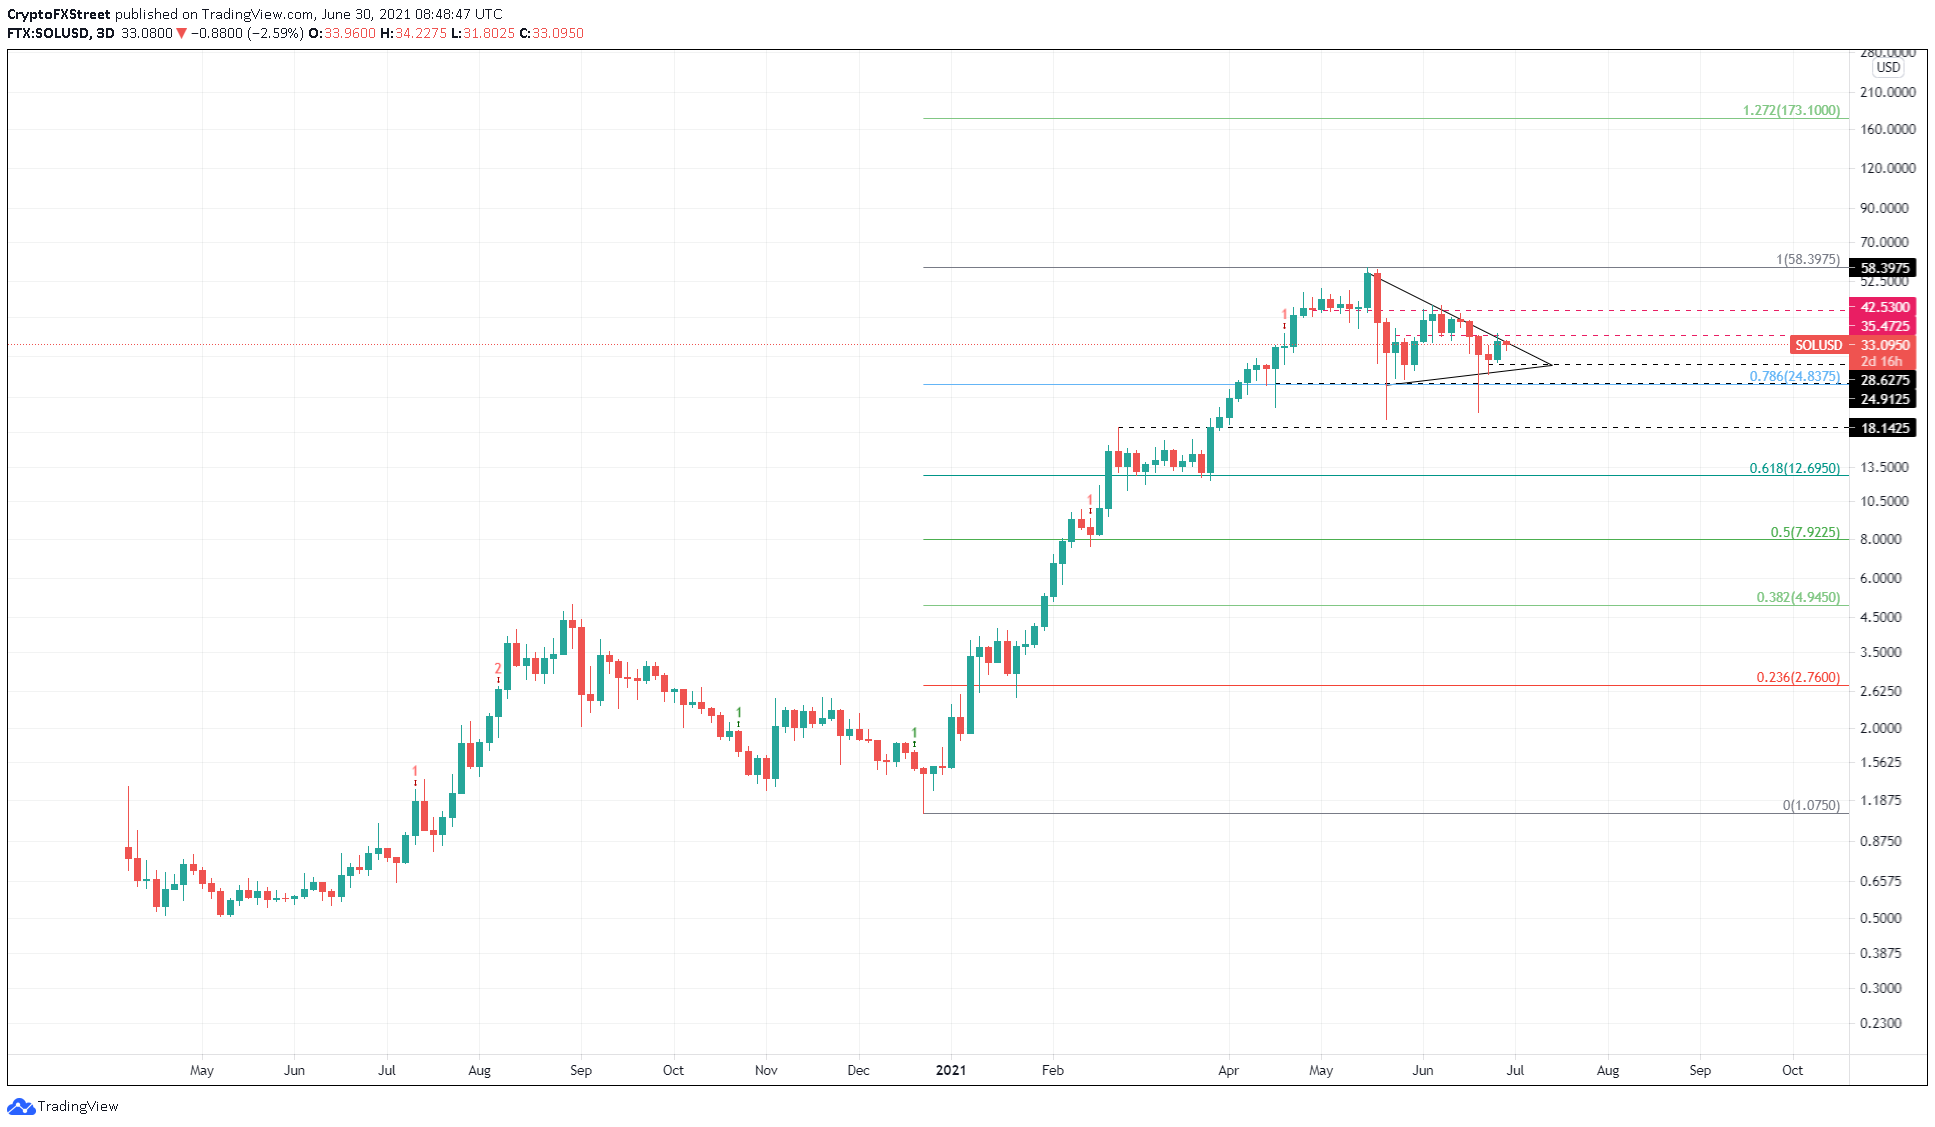
SOL/USD 1-day chart
On the flip side, Solana price might head lower, bounce off the lower trend line at 28.63 or $27.32. Such a move would not affect the bullish thesis. However, a breakdown of the support barrier at $24.91 would end the optimistic narrative and might delay or halt the uptrend.
Chainlink price flirts with critical support barrier
Chainlink price has not witnessed a good recovery like Solana or even Bitcoin. In fact, LINK is sticking very close to its bottom. The reason why Chainlink might soon hit its all-time high or more can be split into two factors – its current position factored with the Momentum Reversal Indicator (MRI) and the supply on exchanges.
From a technical perspective, the Chainlink price is currently hovering around the support level at $19.22, the peak of the August 2020 bull run. Therefore, flipping this area into support would provide the oracle token a chance to consolidate and catapult from there to vital resistance levels.
Further helping LINK’s case is the MRI, which has flashed a buy signal in the form of a green ‘one’ candlestick on the 3-day chart. This technical formation forecasts a one-to-four candlestick upswing.
The rally that originates from the buy signal mentioned above might push Chainlink price toward a critical resistance level at $32.85.
Clearing this barrier will allow LINK to surge swiftly to the next ceiling at $43.48 due to price inefficiency seen during the May 19 drop.
However, if Chainlink price sets up a daily candlestick close above $43.48, it will put the all-time high at $52.9 in an attainable spot.
In a highly bullish scenario, LINK price could extend the bull run to the 127.2% Fibonacci extension level at $139.35.
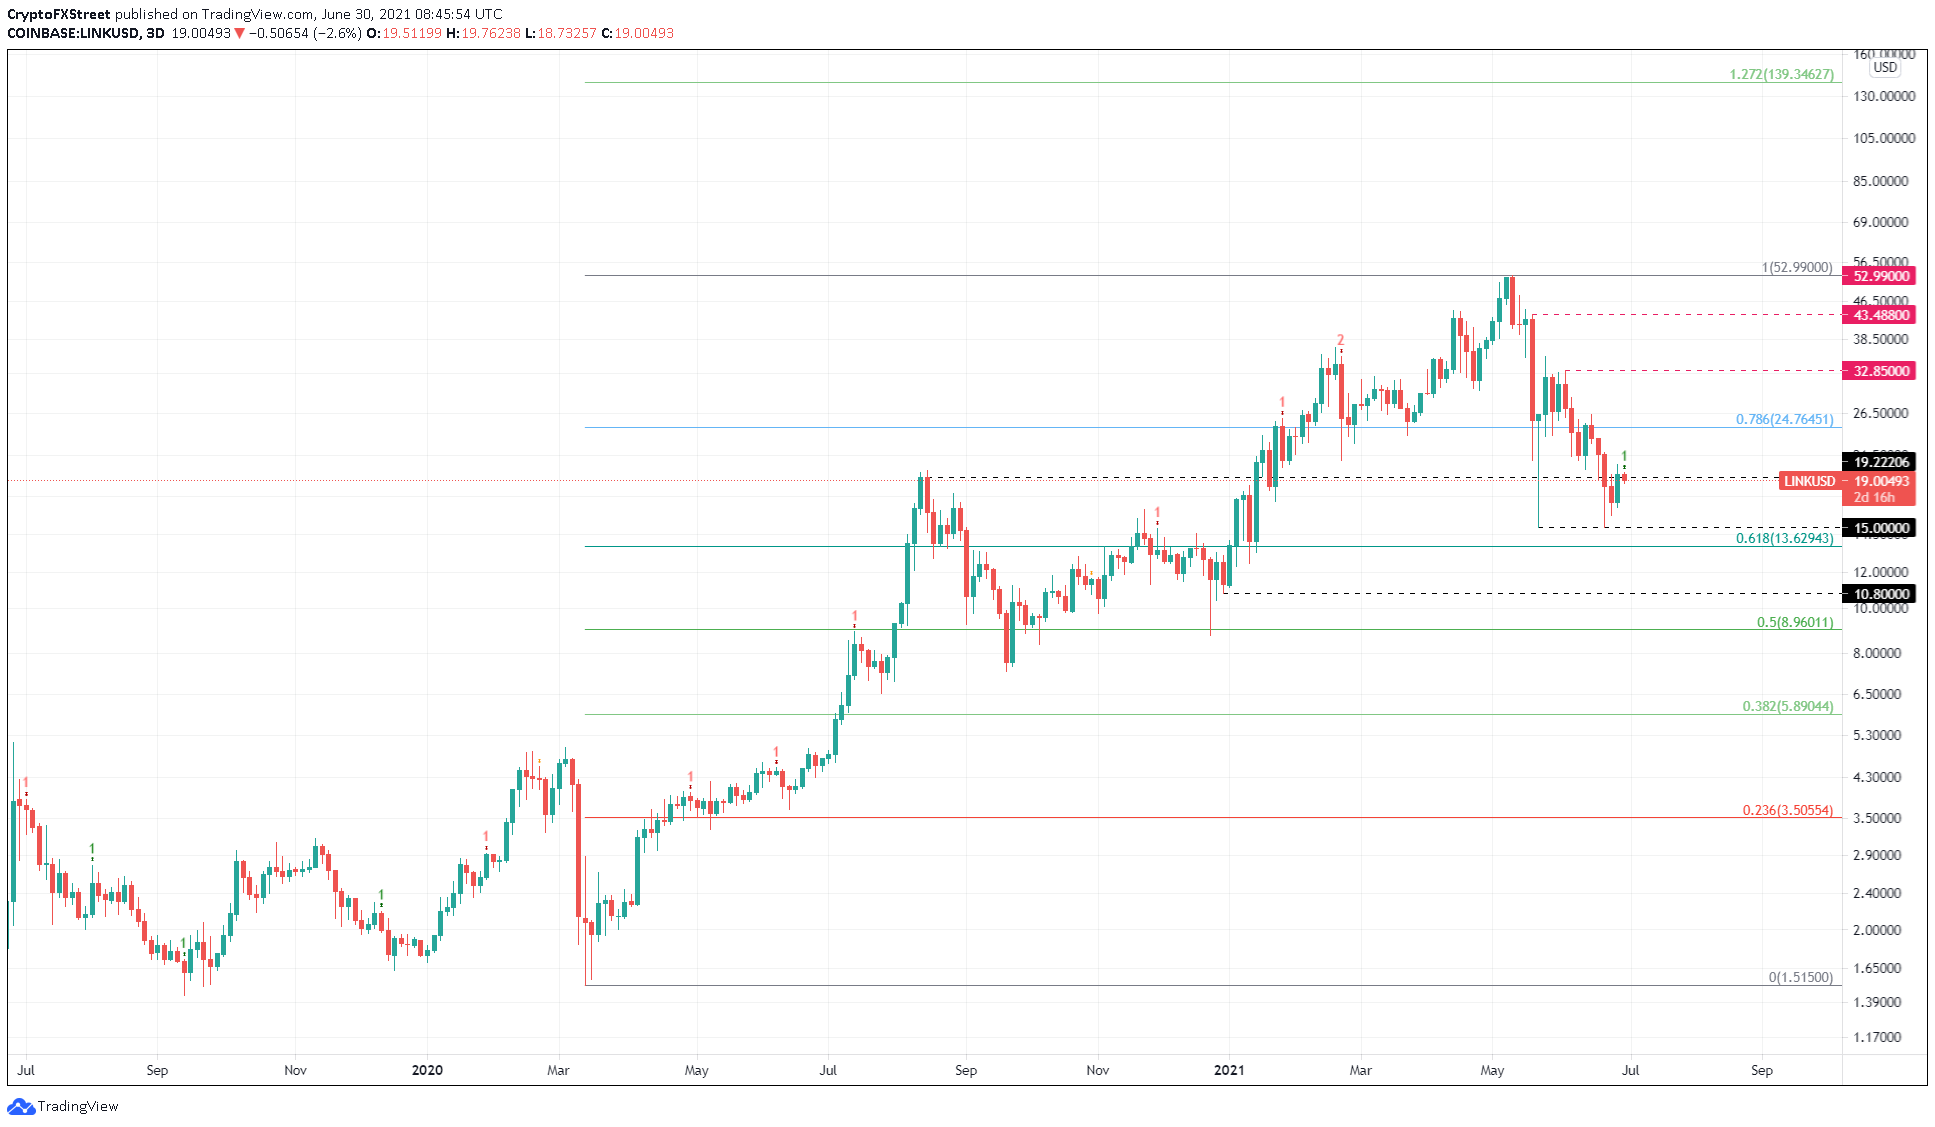
LINK/USD 3-day chart
Supporting this massive upswing for Chainlink price is the supply of LINK on exchanges, which has not set up a meaningful higher high since early September 2020. The number of LINK tokens held on centralized entities has dropped from 177.19 million to 143.12 million over the past ten months.
This 19% decline indicates that investors are moving their holdings off exchanges, which suggests that they are confident in LINK price performance in the future.
A similar decline in ETH held on exchanges was observed during the recent bull run, which led to massive gains for users holding Ether. Therefore, if a similar trend were to occur, LINK price would not only tag its all-time high at $52.90 but rise beyond it.
 [13.35.46, 30 Jun, 2021]-637606426817600423.png)
LINK supply held on exchanges chart
Regardless of the bullish outlook, if Chainlink price breaks down the foothold at $15, the uptrend hypothesis will be delayed. In such a case, LINK might drop 28% to tag the support level at $10.8.
A spike in selling pressure that shatters this barrier will invalidate the bullish thesis and might push the oracle token to the 50% Fibonacci retracement level at $8.96.
Icon price might quadruple soon
Icon (ICX) price has been trading inside a rounded bottom pattern since June 2018. The ICX price action since February 2020 has been a mirror of its prior moves. Going by this logic, the Icon price is currently forming a base that kick-starts the last leg of the fractal, which could quickly push it to the current all-time high at $3.19 and possibly beyond it.
From a mid-to-short term perspective, the Icon price is trading at $0.80, coinciding with a crucial barrier. A decisive daily candlestick close above this level opens up the path for an upswing to the next meaningful resistance ceiling at $2.05.
Supporting this uptrend is the Momentum Reversal Indicator (MRI), which has flashed a buy signal in the form of a red ‘two,’ which indicates the massive bearish descent seen so far and further stresses the need for a bull rally.
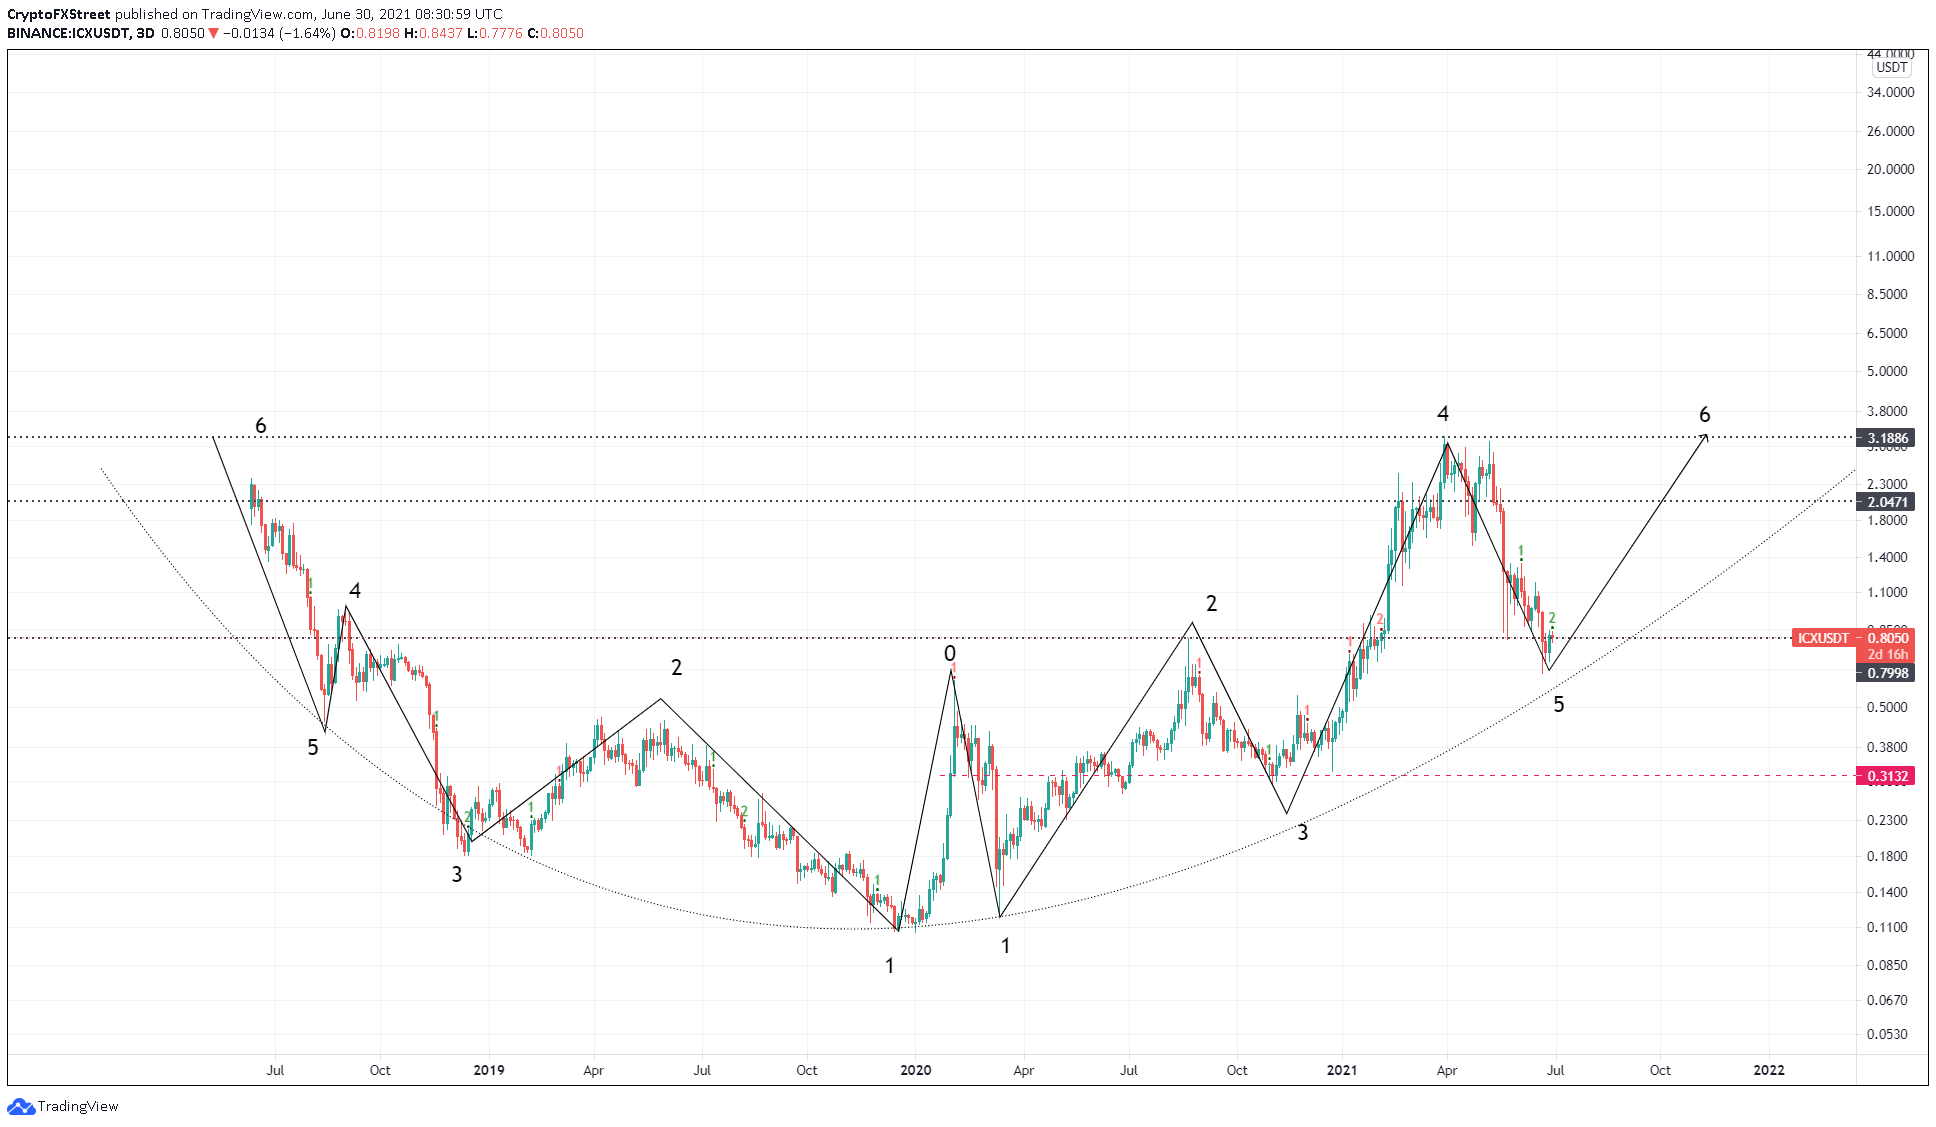
ICX/USDT 3-day chart
A popular analyst on Twitter, who goes by the screen name ‘DaveTheWave’ posted a chart with a similar idea. Based on his analysis, the first target for ICX was $2.669, which was hit in late March.
However, his long-term projections indicate that Icon price might go up to $100.
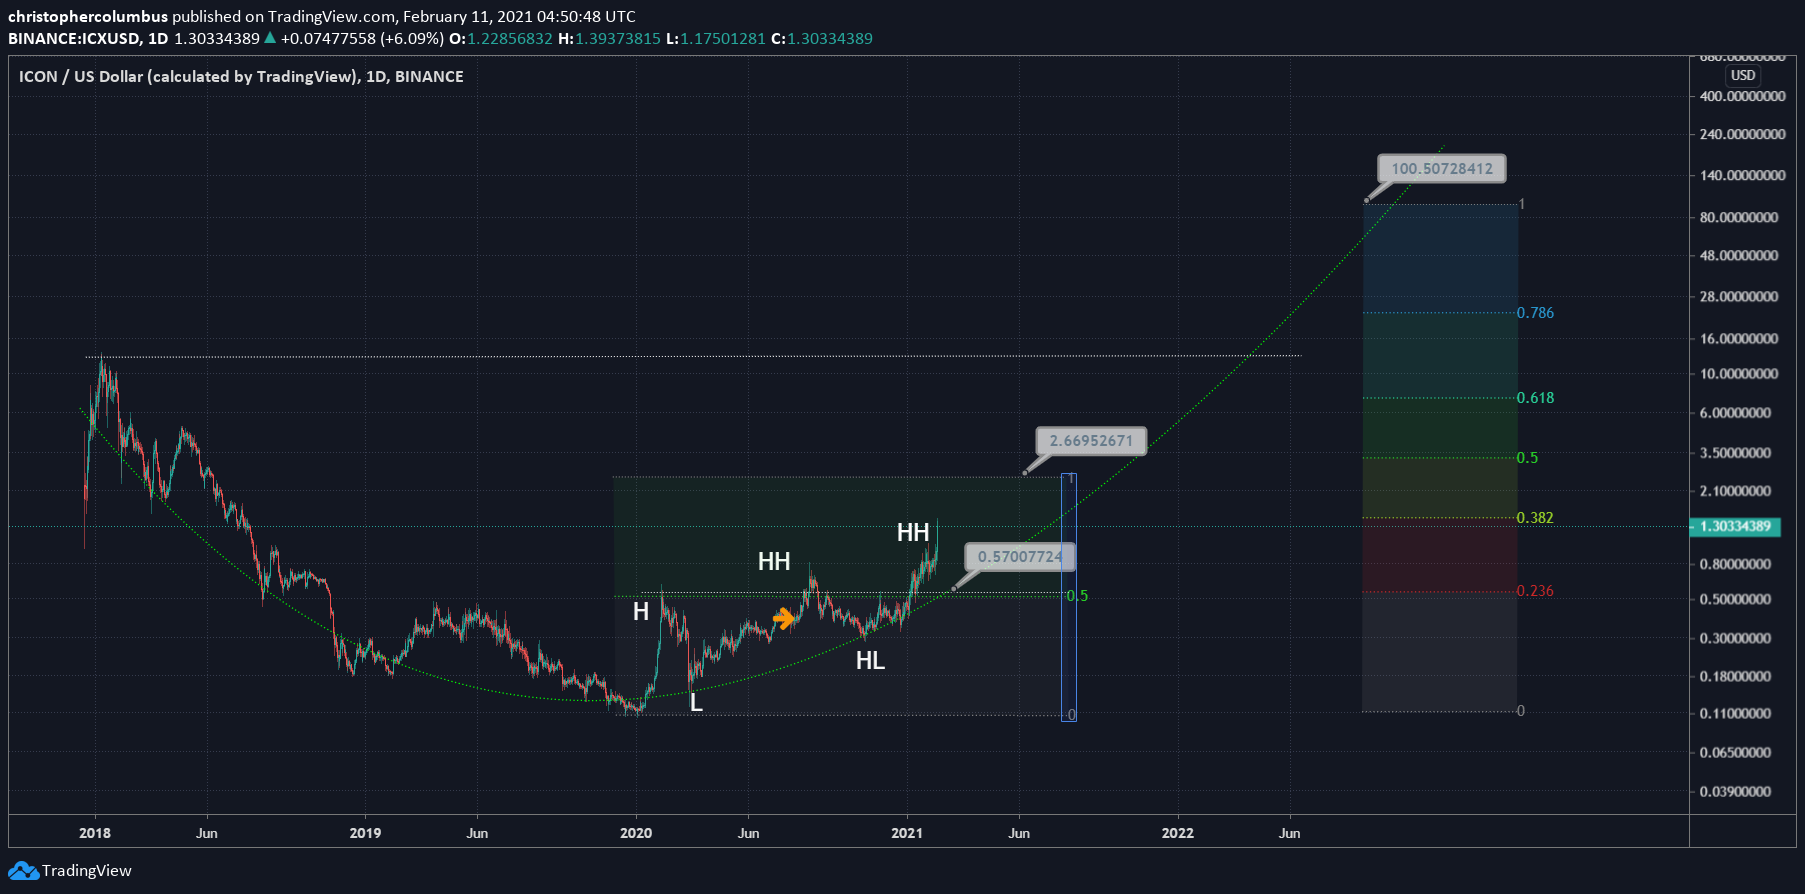
ICX/USD 1-day chart
A breakdown of the rounded bottom pattern might trigger a sell-off and halt the bullish thesis explained above. Such a move could drag Icon price to its immediate support level at $0.60.
Information on these pages contains forward-looking statements that involve risks and uncertainties. Markets and instruments profiled on this page are for informational purposes only and should not in any way come across as a recommendation to buy or sell in these assets. You should do your own thorough research before making any investment decisions. FXStreet does not in any way guarantee that this information is free from mistakes, errors, or material misstatements. It also does not guarantee that this information is of a timely nature. Investing in Open Markets involves a great deal of risk, including the loss of all or a portion of your investment, as well as emotional distress. All risks, losses and costs associated with investing, including total loss of principal, are your responsibility. The views and opinions expressed in this article are those of the authors and do not necessarily reflect the official policy or position of FXStreet nor its advertisers. The author will not be held responsible for information that is found at the end of links posted on this page.
If not otherwise explicitly mentioned in the body of the article, at the time of writing, the author has no position in any stock mentioned in this article and no business relationship with any company mentioned. The author has not received compensation for writing this article, other than from FXStreet.
FXStreet and the author do not provide personalized recommendations. The author makes no representations as to the accuracy, completeness, or suitability of this information. FXStreet and the author will not be liable for any errors, omissions or any losses, injuries or damages arising from this information and its display or use. Errors and omissions excepted.
The author and FXStreet are not registered investment advisors and nothing in this article is intended to be investment advice.
Recommended Content
Editors’ Picks

Shiba Inu eyes positive returns in April as SHIB price inches towards $0.000015
Shiba Inu's on-chain metrics reveal robust adoption, as addresses with balances surge to 1.4 million. Shiba Inu's returns stand at a solid 14.4% so far in April, poised to snap a three-month bearish trend from earlier this year.

AI tokens TAO, FET, AI16Z surge despite NVIDIA excluding crypto-related projects from its Inception program
AI tokens, including Bittensor and Artificial Superintelligence Alliance, climbed this week, with ai16z still extending gains at the time of writing on Friday. The uptick in prices of AI tokens reflects a broader bullish sentiment across the cryptocurrency market.

Bitcoin Weekly Forecast: BTC consolidates after posting over 10% weekly surge
Bitcoin price is consolidating around $94,000 at the time of writing on Friday, holding onto the recent 10% increase seen earlier this week. This week’s rally was supported by strong institutional demand, as US spot ETFs recorded a total inflow of $2.68 billion until Thursday.

XRP price could renew 25% breakout bid on surging institutional and retail adoption
Ripple price consolidates, trading at $2.18 at the time of writing on Friday, following mid-week gains to $2.30. The rejection from this weekly high led to the price of XRP dropping to the previous day’s low at $2.11, followed by a minor reversal.
Bitcoin Weekly Forecast: BTC consolidates after posting over 10% weekly surge
Bitcoin (BTC) price is consolidating around $94,000 at the time of writing on Friday, holding onto the recent 10% increase seen earlier this week.

The Best brokers to trade EUR/USD
SPONSORED Discover the top brokers for trading EUR/USD in 2025. Our list features brokers with competitive spreads, fast execution, and powerful platforms. Whether you're a beginner or an expert, find the right partner to navigate the dynamic Forex market.