These three cryptocurrencies look primed to test the May lows
- XLM price impulsiveness on bounces has been non-existent since the beginning of June as the digital asset rests on lower trend line.
- Litecoin price locked in a symmetrical triangle below the union of the 200-day simple moving average (SMA) with the anchored VWAP.
- Chiliz price faces a quadfecta of resistance that may require a revolution to defeat.

XLM price has stubbornly resisted the notable bounce in Bitcoin, favoring to wedge quietly higher along the lower trend line of a symmetrical triangle. Litecoin price is locked in a symmetrical triangle continuation pattern below formidable resistance with no hint of accumulation. Chiliz price has failed to capitalize on the euphoria surrounding the beginning of the European Cup, preferring to trend sideways.
XLM price...we have a problem!
XLM price is propped up by the symmetrical triangle’s lower trend line and 61.8% Fibonacci retracement of the March 2020-May 2021 rally. However, the rebound has been limited, and daily volume shows passive interest in participating, despite the considerable rebound in Bitcoin. Without a daily close above the anchored volume-weighted average price (anchored VWAP) from November 23, 2020, at $0.368 and the 200-day SMA at $0.380, Stellar is primed to test the May lows.
To review, a symmetrical triangle can be referred to as a coil and usually forms during a trend as a continuation pattern. There are examples when symmetrical triangles mark significant trend reversals, but more often, they mark the continuation of the current trend.
In the case of XLM price, there is an established downtrend preceding the symmetrical triangle. The Stellar symmetrical triangle has four touches on the trend lines, two on the upper and two on the lower. The volume has contracted throughout the formation, representing the quiet before the storm.
A potential negative for the Stellar triangle is the resolution will be beyond 80% of the distance from the triangle beginning to the apex, possibly indicating that the resulting move to the downside may be smaller than the projected measured move of 50%.
At the time of writing, XLM price is approximately 17% away from testing the May 23 low of $0.274. Based on the lack of accumulation in the triangle, the closeness of Stellar to the apex, zero impulsiveness from the lower trend line and the fierce resistance framed by the anchored VWAP and 200-day SMA, the probabilities are high XLM price will test the May 23 low moving forward.
It will take an XLM price close below the triangle’s lower trend line and the 61.8% Fibonacci retracement at $0.320 to confirm the negative outlook.
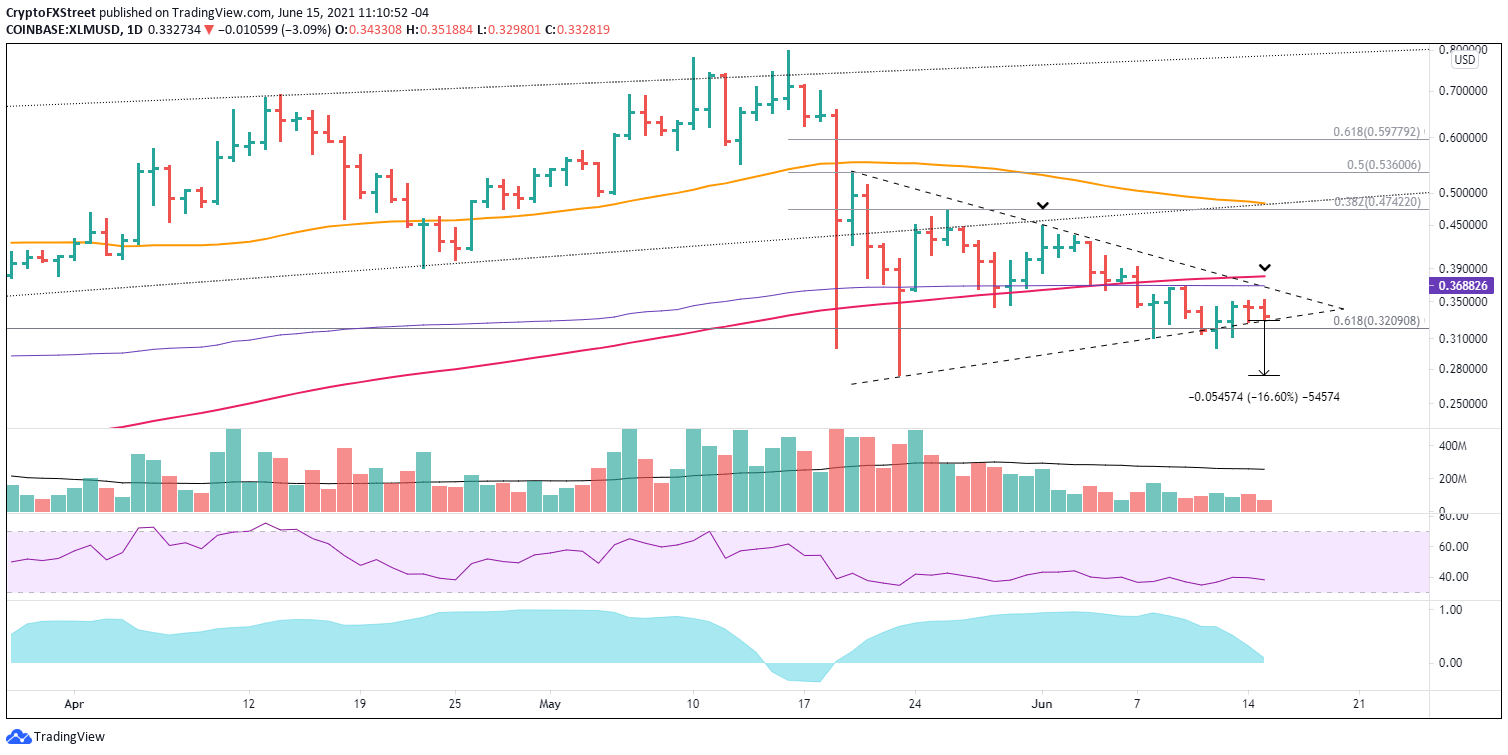
XLM/USD daily chart
XLM price will need a daily close above the anchored VWAP and 200-day SMA at $0.380 to void the decidedly bearish outlook
Litecoin price could be sinking in quicksand
A cursory review of Litecoin price since the beginning of 2017 reveals a boom-bust digital asset, marked by a 10,000% rally in 2017, a 90% plunge into December 2018 and then a 550% rally followed by an 80% collapse, and finally, the recent 1,500% advance. The 70% LTC correction in May should not have been a surprise, but it may not represent the end of the bust leg.
Litecoin price is reclining below the explicit resistance outlined by the upper trend line of a symmetrical triangle, the anchored VWAP from November 16, 2020, at $182.98 and the 200-day SMA at $186.28. Adding to the bearish outlook is the lack of LTC impulsiveness as it has rebounded from the triangle’s lower trend line, revealing no commitment or emotion for the altcoin.
A daily close below the lower trend line at $158.35 would be the initial confirmation that the next LTC leg down is commencing. A further daily close below the June 8 low would be the final confirmation.
If Litecoin price does reach the May 23 low at $117.58, it would equate to a 32% decline from the price at the time of writing and likely establish the firm low needed to begin a new boom leg of the boom-bust cycle.
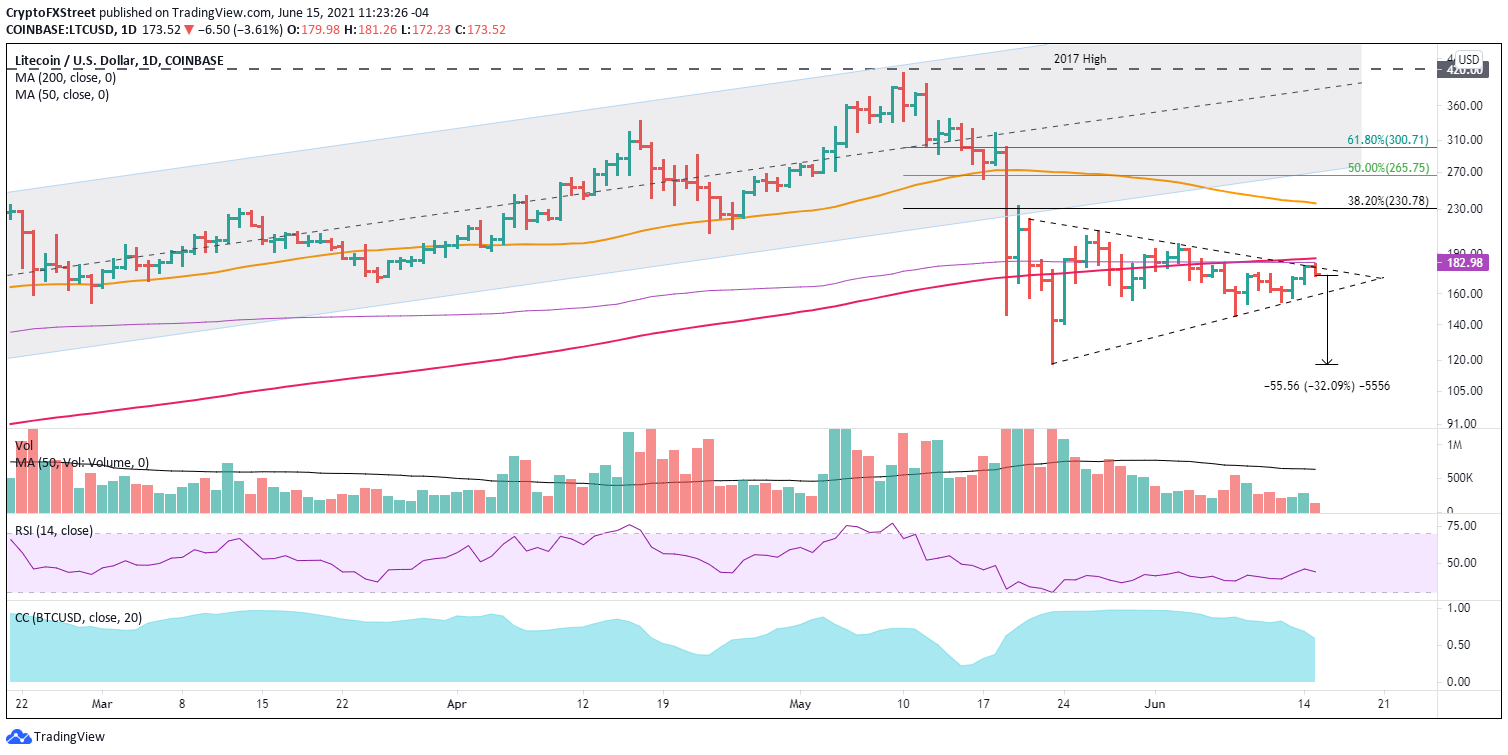
LTC/USD daily chart
Conversely, a daily close above the anchored VWAP and 200-day SMA at $186.28 would trigger a rethink of the LTC bearish narrative.
Chiliz price consolidation sowing doubts for CHZ enthusiasts
Chiliz price rocketed 70% from the June 9 low to the May 11 high in the run-up to the kick-off of the European Cup. The expansive rally did capture the attention of the cryptocurrency market and the remaining CHZ faithful. Still, the altcoin has since stumbled sideways for the last four days, unable to seize on the attention.
For weeks, Chiliz price has been trading in an ascending triangle that began from the May 23 low, with $0.364 serving as the upside resistance. The May 11 spike higher was matched by a quadfecta of opposition that included the anchored VWAP from February 11 at $0.337, the April declining trend line at $0.351, the upper trend line of the CHZ ascending triangle and the declining 50-day SMA at $0.376.
Chiliz price fumbled the opportunity afforded by the European Cup and has shifted into a range sandwiched by the April declining trend line and the union of the 200-day SMA at $0.231 with the ascending triangle’s lower trend line.
Considering the failed break-out attempt by Chiliz price, a daily close below the 200-day SMA at $0.230 and the triangle’s lower trend line at $0.223 should direct market operator’s attention to the downside. A close below the June 8 low of $0.204 will confirm and promptly lead to a sweep of the May 19 and 23 lows around $0.163, transmitting a 40% decline from the Chiliz price.
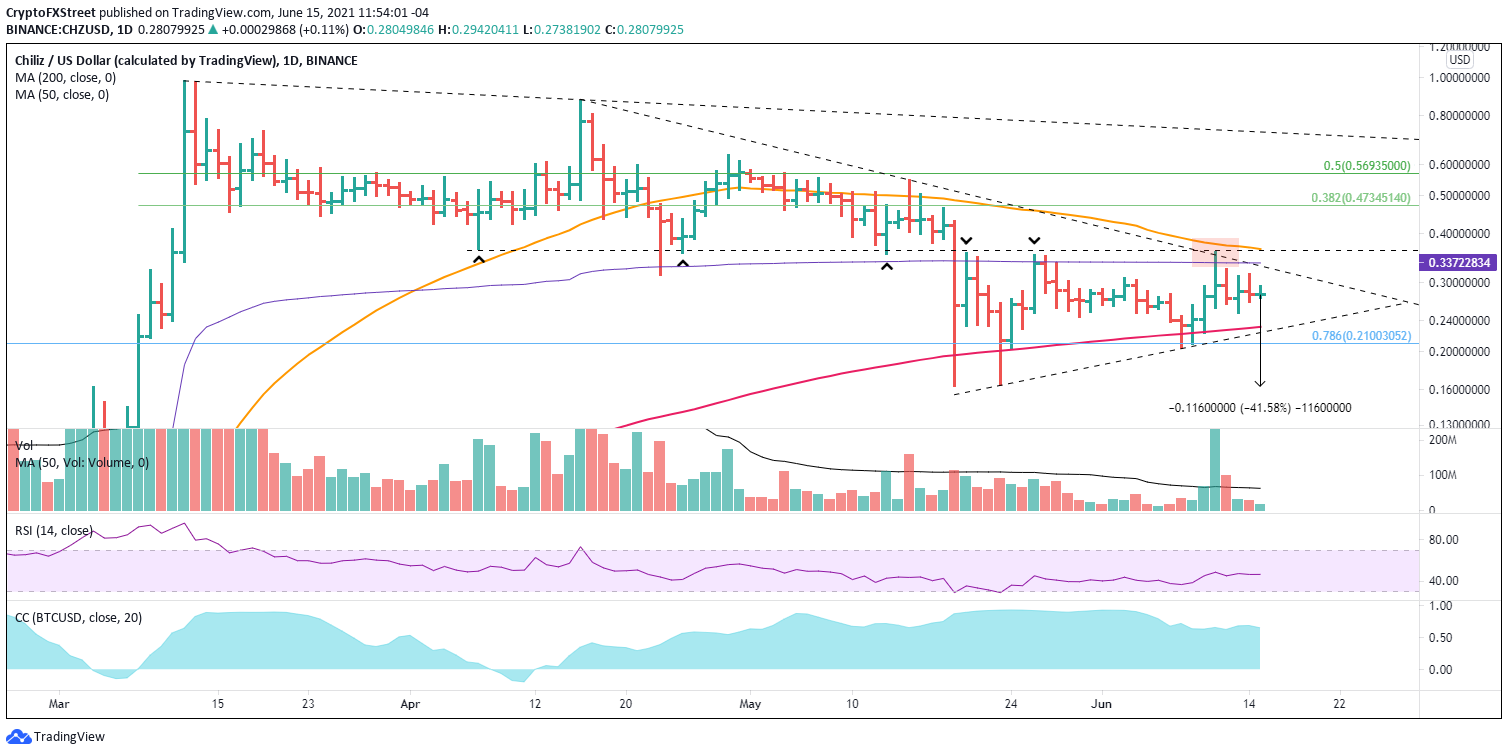
CHZ/USD daily chart
Until Chiliz price can capture $0.364, it is difficult to envision any other narrative, then bearish.
The bounce in Bitcoin has modestly improved the sentiment in the cryptocurrency market. Still, in many altcoins, the technical outlook remains blurred as imposing resistance levels frustrate breakout attempts from distinguishable chart patterns or formations. In the case of XLM, LTC and CHZ, the above-mentioned technical observations are stacked in favor of bearish narratives improved by precise trigger levels and clear invalidation points.
It is in the best interest of investors to use the defined resistance levels for short trades or wait for confirmation of a breakdown. Either way, it is advisable to be nimble and disciplined.
Author

Sheldon McIntyre, CMT
Independent Analyst
Sheldon has 24 years of investment experience holding various positions in companies based in the United States and Chile. His core competencies include BRIC and G-10 equity markets, swing and position trading and technical analysis.


