These five cryptocurrencies may continue to surprise to the upside
Bitcoin, ETH, BNB, STX, and IMX remain strong on the charts, increasing the likelihood of more gains in the near term.
Bitcoin is on track to close the week with gains of more than 23%. The banking crisis in the United States and Europe seems to have boosted buying in Bitcoin, indicating that the leading cryptocurrency is behaving as a safe haven asset in the near term.
All eyes are on the Federal Reserve’s meeting on March 21 and 22. The failure of the banks in the U.S. has increased hopes that the Fed will not hike rates in the meeting. The CME FedWatch Tool shows a 38% probability of a pause and a 62% probability of a 25 basis points rate hike on March 22.
Analysts are divided on the consequences of the current crisis on the economy. Former Coinbase chief technology officer Balaji Srinivasan believes that the U.S. will enter a period of hyperinflation while pseudonymous Twitter user James Medlock believes otherwise. Srinivasan plans to wage a millionaire bet with Medlock and another person that Bitcoin’s price will reach $1 million by June 17.
Although anything is possible in crypto markets, traders should be prudent in their trading and not get carried away with lofty targets.
Let’s study the charts of Bitcoin and altcoins that are showing signs of the resumption of the up-move after a minor correction.
Bitcoin price analysis
Bitcoin soared above the $25,250 resistance on March 17, completing a bullish inverse head and shoulders (H&S) pattern.
Usually, a breakout from a major setup returns to retest the breakout level but in some cases, the rally continues unabated.
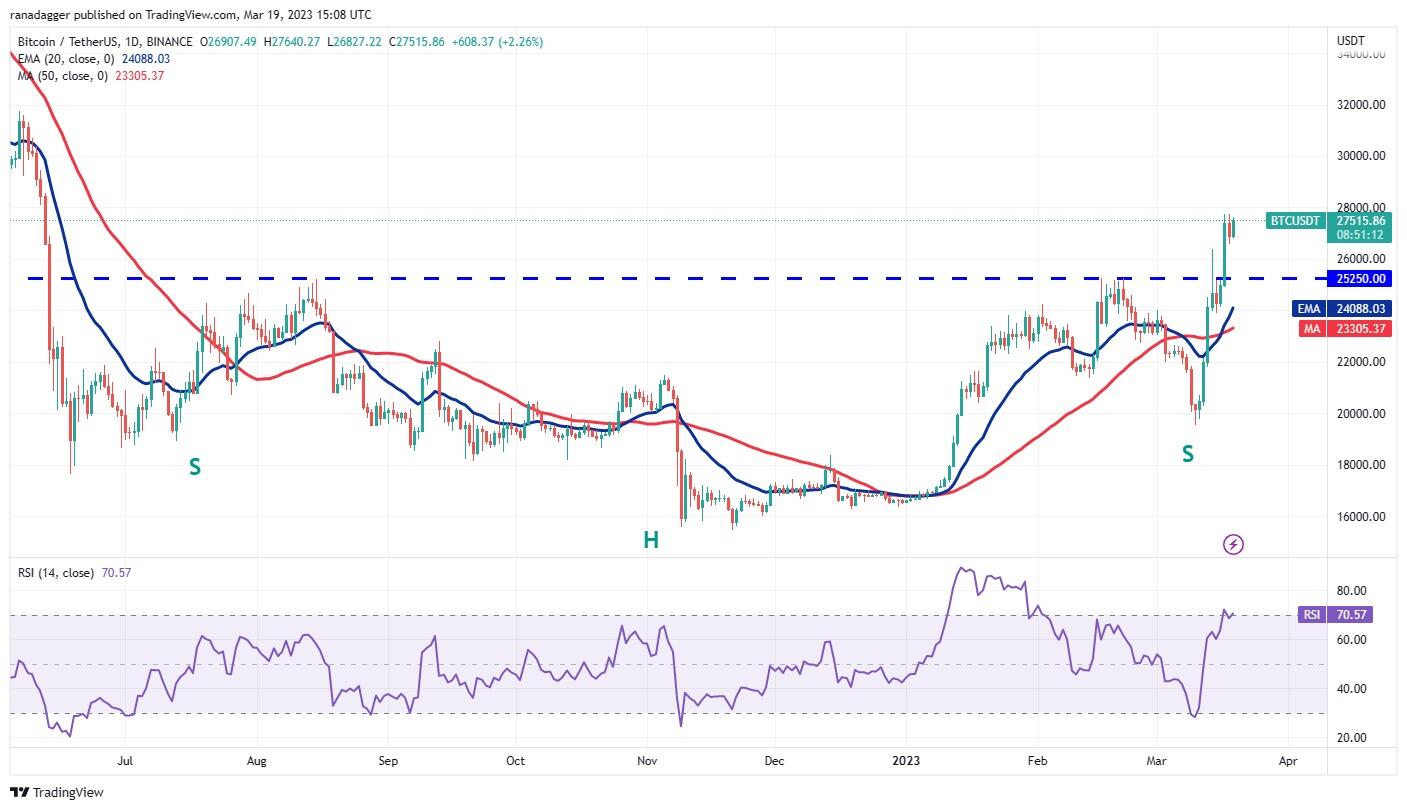
BTC/USDT daily chart. Source: TradingView
The rising 20-day exponential moving average ($24,088) and the relative strength index (RSI) in the overbought territory indicate advantage to buyers. If the price breaks above $28,000, the rally could pick up momentum and surge to $30,000 and thereafter to $32,000. This level is likely to witness strong selling by the bears.
Another possibility is that the price turns down from the current level but rebounds off $25,250. That will also keep the bullish trend intact.
The positive view will be invalidated in the near term if the price plummets below the moving averages. Such a move will suggest that the break above $25,250 may have been a bull trap. That could open the doors for a possible drop to the psychologically critical level of $20,000.
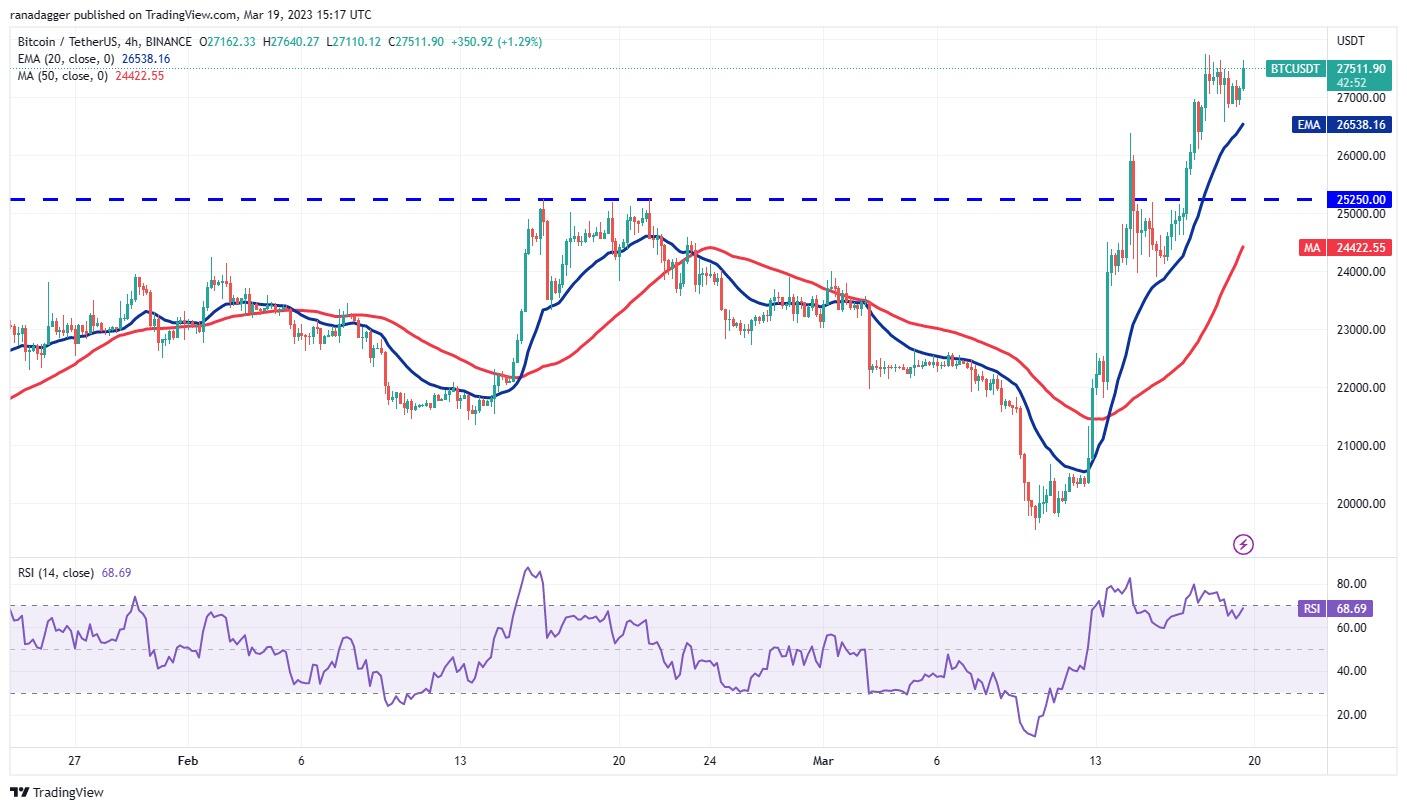
BTC/USDT 4-hour chart. Source: TradingView
The 4-hour chart shows that the BTC/USDT pair is facing profit-booking near $27,750 but a positive sign is that the pullback has been shallow. Buyers will try to drive the price above $28,000 and resume the uptrend. The pair could then climb toward $30,000.
On the other hand, if the price turns down and slumps below the 20-EMA, it will suggest that the traders are rushing to the exit. That may pull the price down to the important support at $25,250 where the bulls and the bears may witness a tough battle.
Ether price analysis
The bulls conquered the $1,800 resistance on March 18 but could not sustain the higher levels. This shows that the bears are protecting the $1,800 level on Ether with vigor.
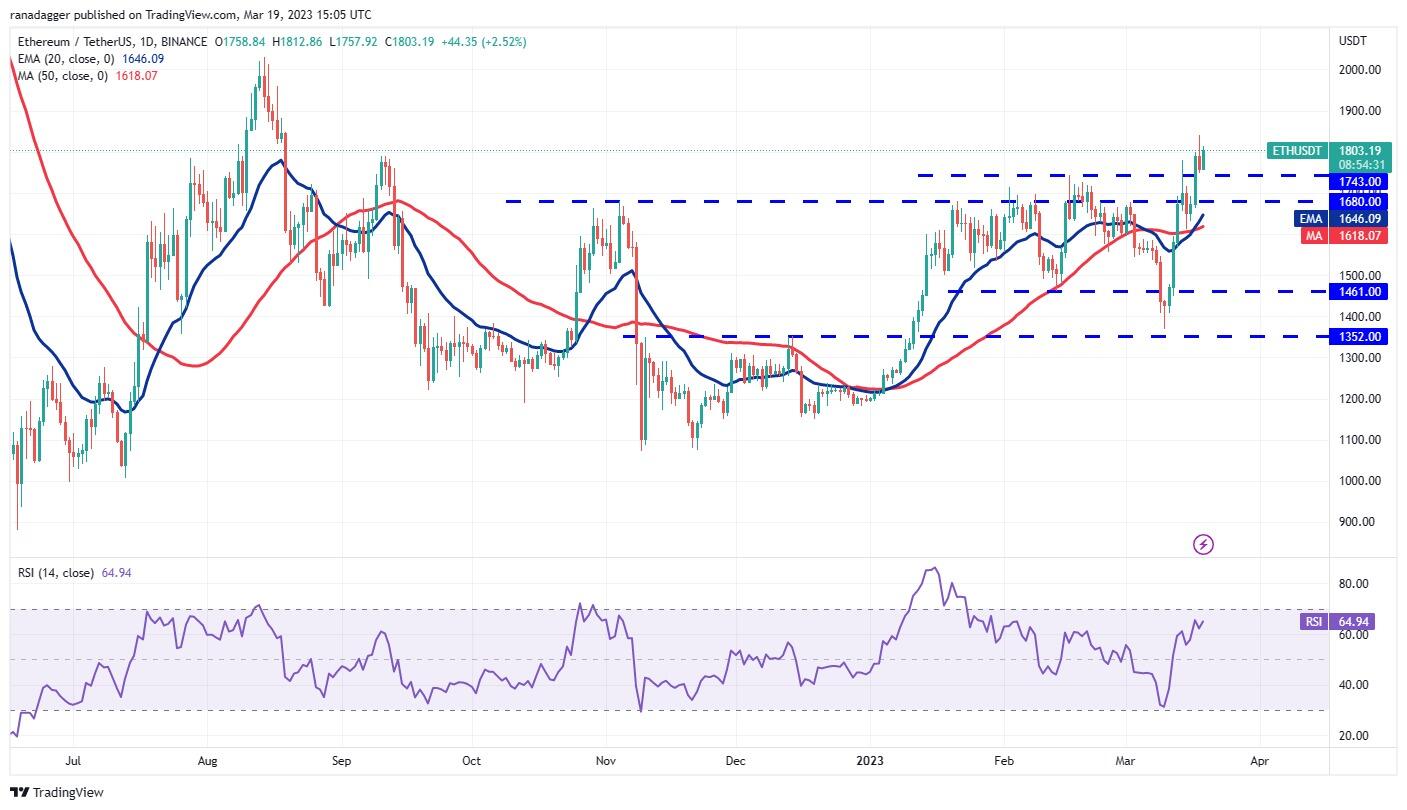
ETH/USDT daily chart. Source: TradingView
The critical support to watch on the downside is the zone between $1,680 and the 20-day EMA ($1,646). If the price rebounds off this zone, it will signal that the sentiment has turned positive and traders are buying on dips.
Buyers will then again try to resume the uptrend and drive the price toward the next target objective at $2,000. This level may prove to be a major hurdle for the bulls to cross.
Contrarily, if the price turns down and slumps below the moving averages, it will suggest that the bulls are losing their grip. The ETH/USDT pair may then drop to $1,461.
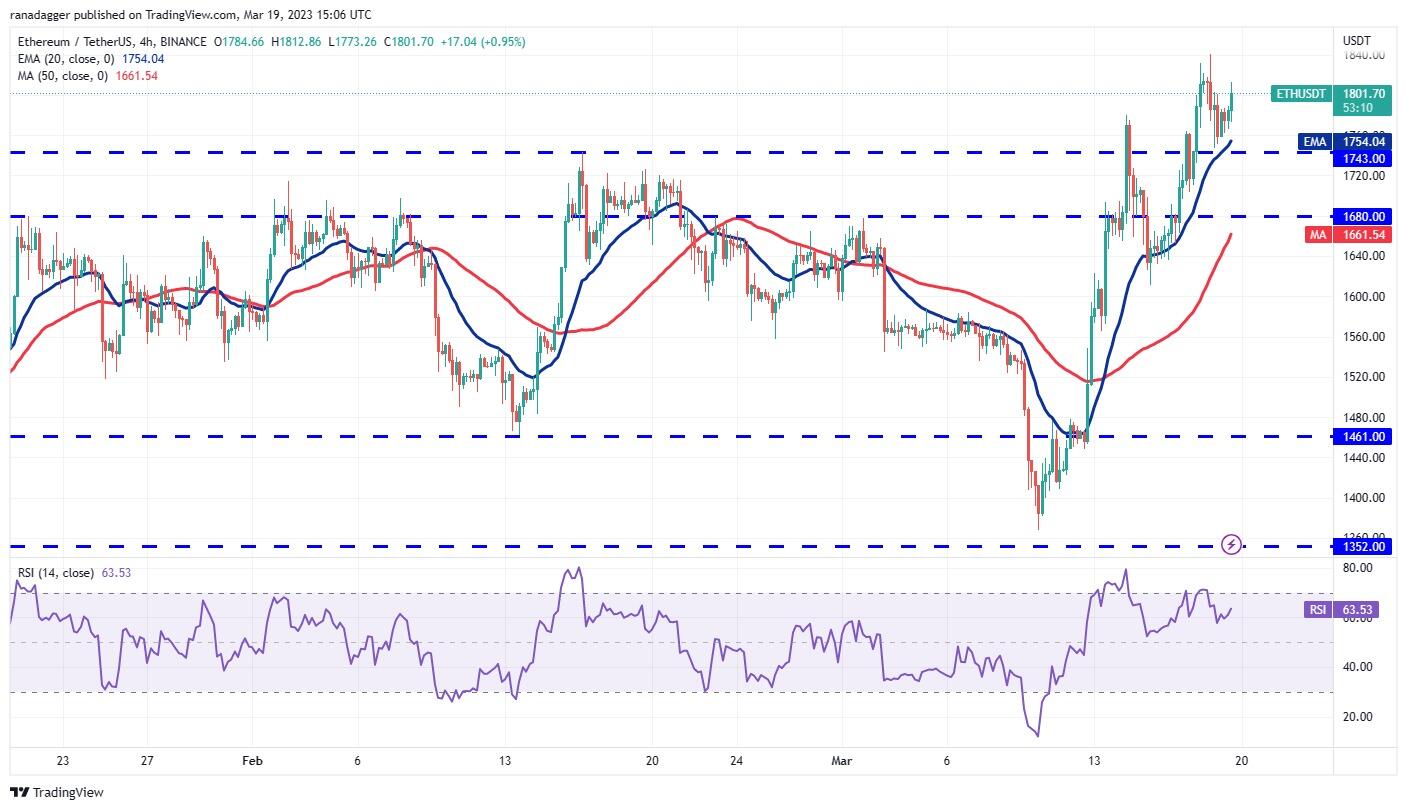
ETH/USDT 4-hour chart. Source: TradingView
The 4-hour chart shows that the pair bounced off the support at $1,743. This suggests that the bulls are buying the shallow dips and are not waiting for a deeper correction to get in. Buyers will next try to kick the price above $1,841. If this level is taken out, the pair may sprint toward $2,000.
Contrarily, if the price turns down and plunges below $1,743, short-term traders may book profits. The pair could then slide to the next important support at $1,680.
BNB price analysis
BNB rose above $338 on March 18, which invalidated the bearish H&S pattern. Usually, when a bearish pattern fails, it attracts buying from the bulls and short covering by the bears.
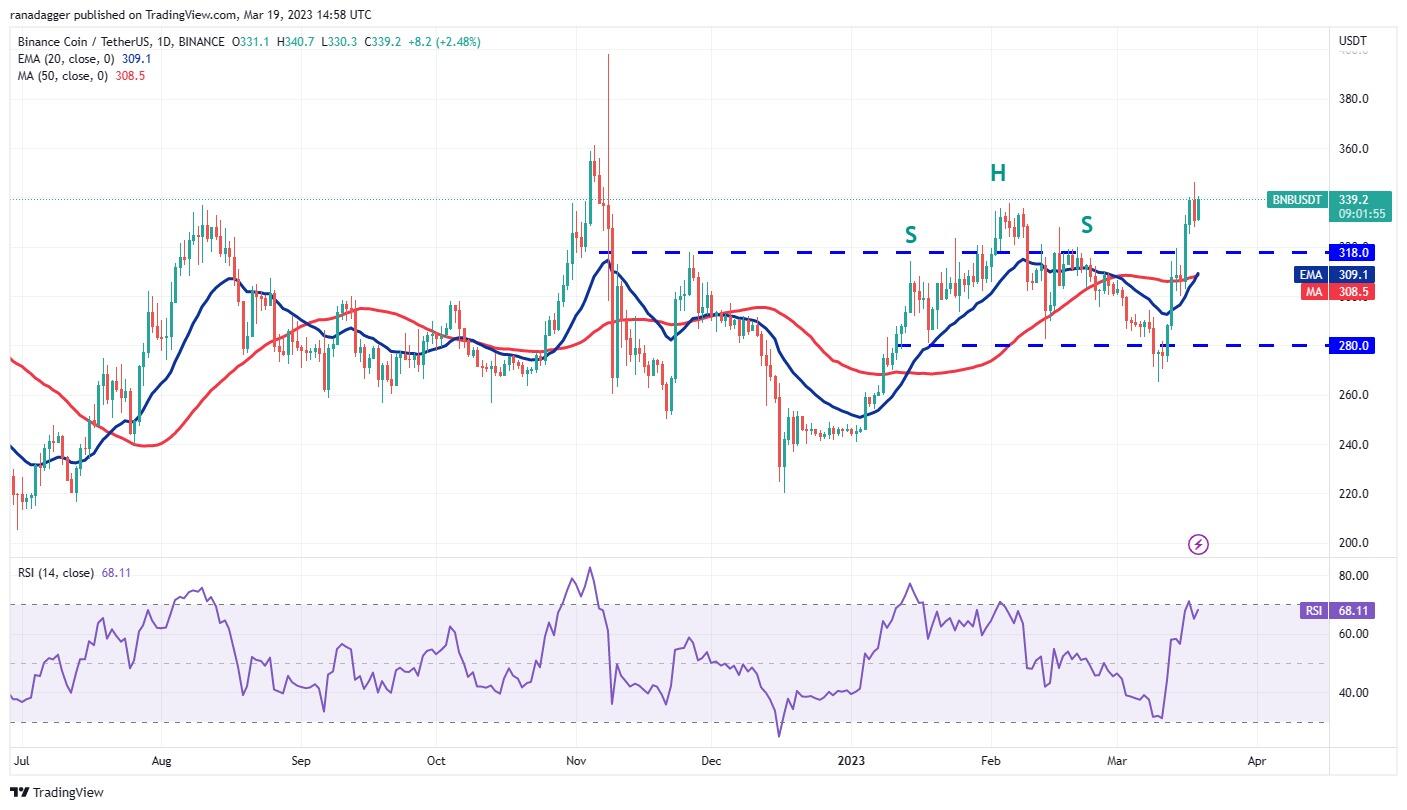
The onus is on the bulls to keep the price above the immediate support at $318. If they manage to do that, the BNB/USDT pair could first climb to $360 and thereafter dash toward $400. The upsloping 20-day EMA ($309) and the RSI near the overbought territory indicate that the path of least resistance is to the upside.
If bears want to gain the upper hand, they will have to yank the price back below the moving averages. This may not be an easy task but if completed successfully, the pair could tumble to $280.
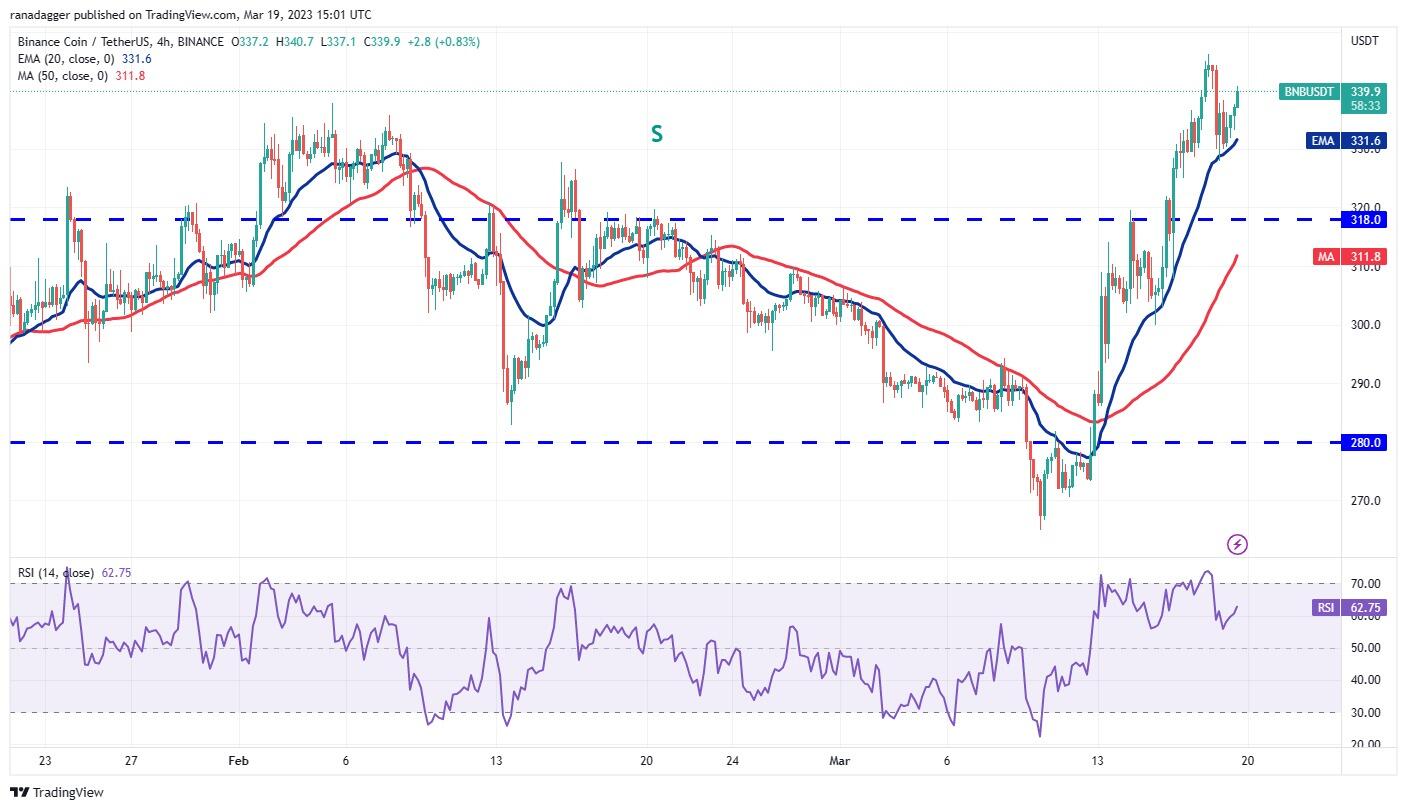
The 4-hour chart shows that the bulls are buying the dips to the 20-EMA. The bears tried to halt the recovery at $338 but the bulls have pierced this resistance. Buyers will try to push the pair to $346. If this level gives way, the pair may continue its uptrend.
Alternatively, if the price turns down and breaks below 20-EMA, it will suggest that the short-term bulls may be booking profits on rallies. The pair could then slump to $318 where the buyers may step in to arrest the decline.
Stacks price analysis
Stacks rallied from $0.52 on March 10 to $1.29 on March 18, a sharp run within a short time. This suggests aggressive buying by the bulls.
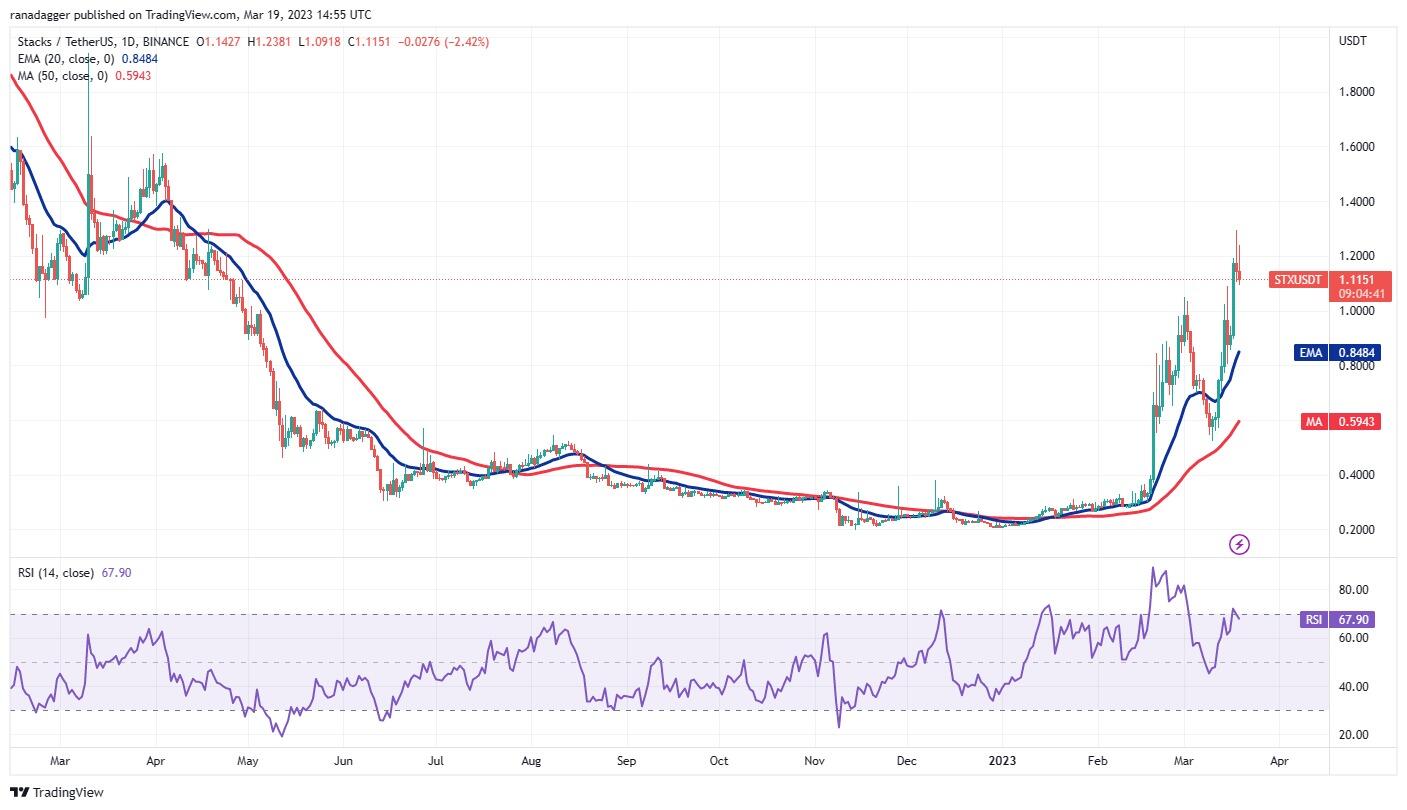
STX/USDT daily chart. Source: TradingView
The STX/USDT pair is witnessing profit-booking near $1.29 but a positive sign is that the bulls have not ceded much ground to the bears. This suggests that minor dips are being bought. Typically, in a strong uptrend, corrections last for one to three days.
If the price turns up and breaks above $1.29, the pair could resume its uptrend. The next stop on the upside is likely to be $1.55 and then $1.80.
The first sign of weakness on the downside will be a break and close below $1. That could clear the path for a drop to the 20-day EMA ($0.84).
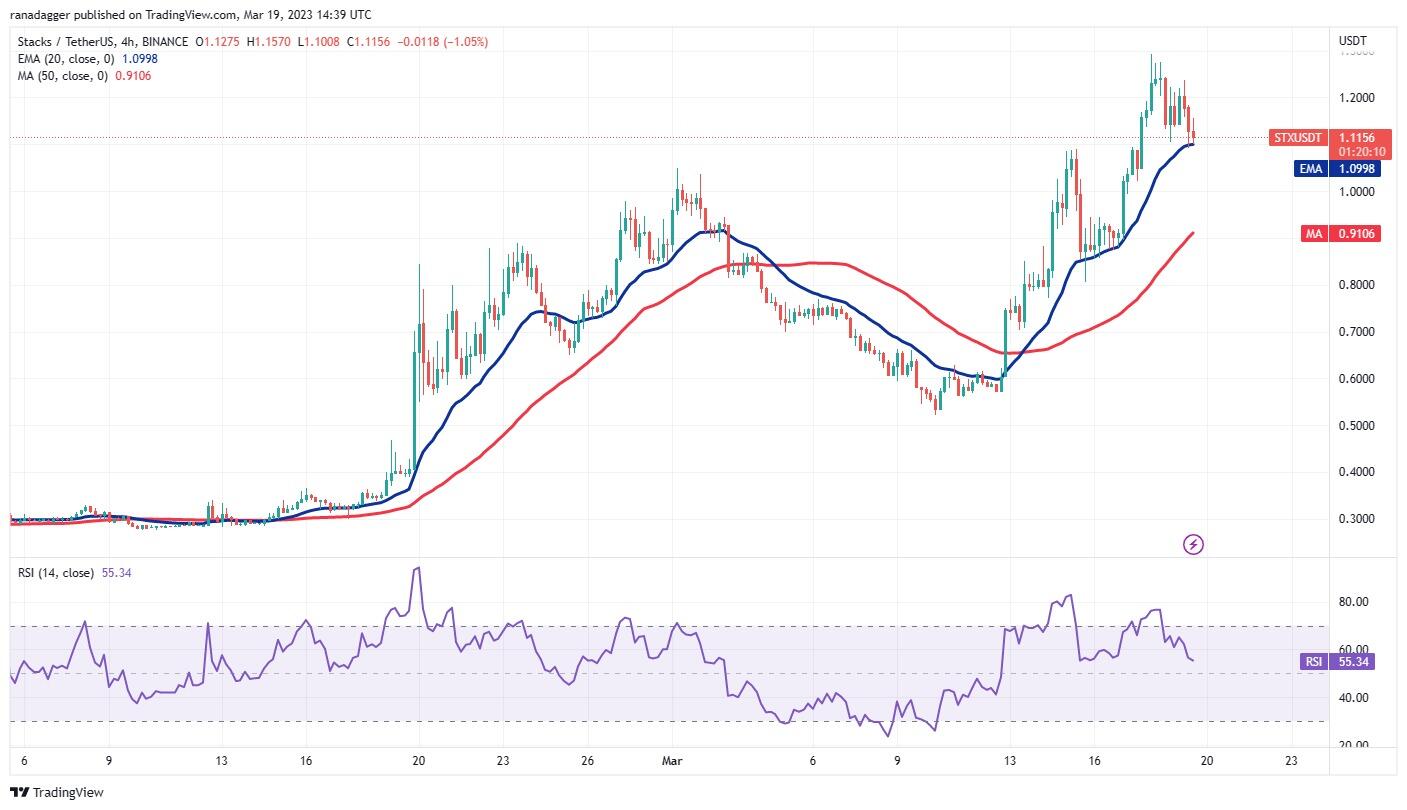
STX/USDT 4-hour chart. Source: TradingView
The pair has corrected to the 20-EMA. This is an important level for the bulls to defend if they want to resume the up-move. If the price rebounds off the 20-EMA, the pair could retest the overhead resistance at $1.29. If bulls overcome this barrier, the next leg of the uptrend may begin.
Conversely, if bears sink the price below the 20-EMA, the pair could slide to $1 and then to the 50-simple moving average. A deeper correction may delay the resumption of the up-move and keep the pair stuck inside a range for a few days.
Immutable price analysis
Immutable (IMX) skyrocketed above the overhead resistance of $1.30 on March 17, which completed the inverse H&S formation. This suggests the start of a potential new uptrend.
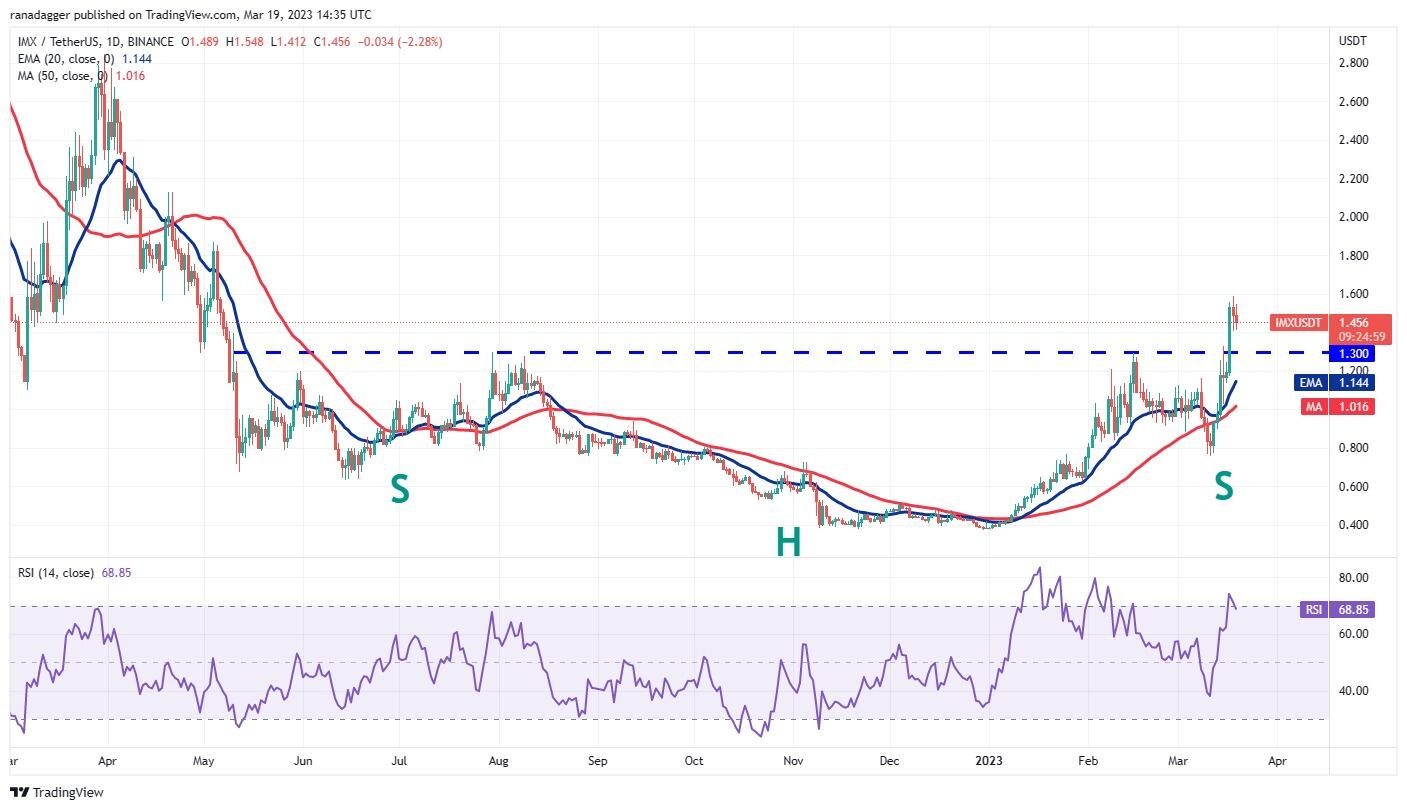
IMX/USDT daily chart. Source: TradingView
Meanwhile, the price may retest the breakout level of $1.30. If the price rebounds off this level with strength, it will suggest that the bulls have flipped the level into support. Buyers will then try to kick the price above $1.59 and resume the uptrend. The IMX/USDT pair may then rally to $1.85 and later to $2. The pattern target of the reversal setup is $2.23.
This positive view could be negated in the near term if the price slips below the moving averages. Such a move will suggest that the break above $1.30 may have been a bull trap. The pair could then drop to $0.80.
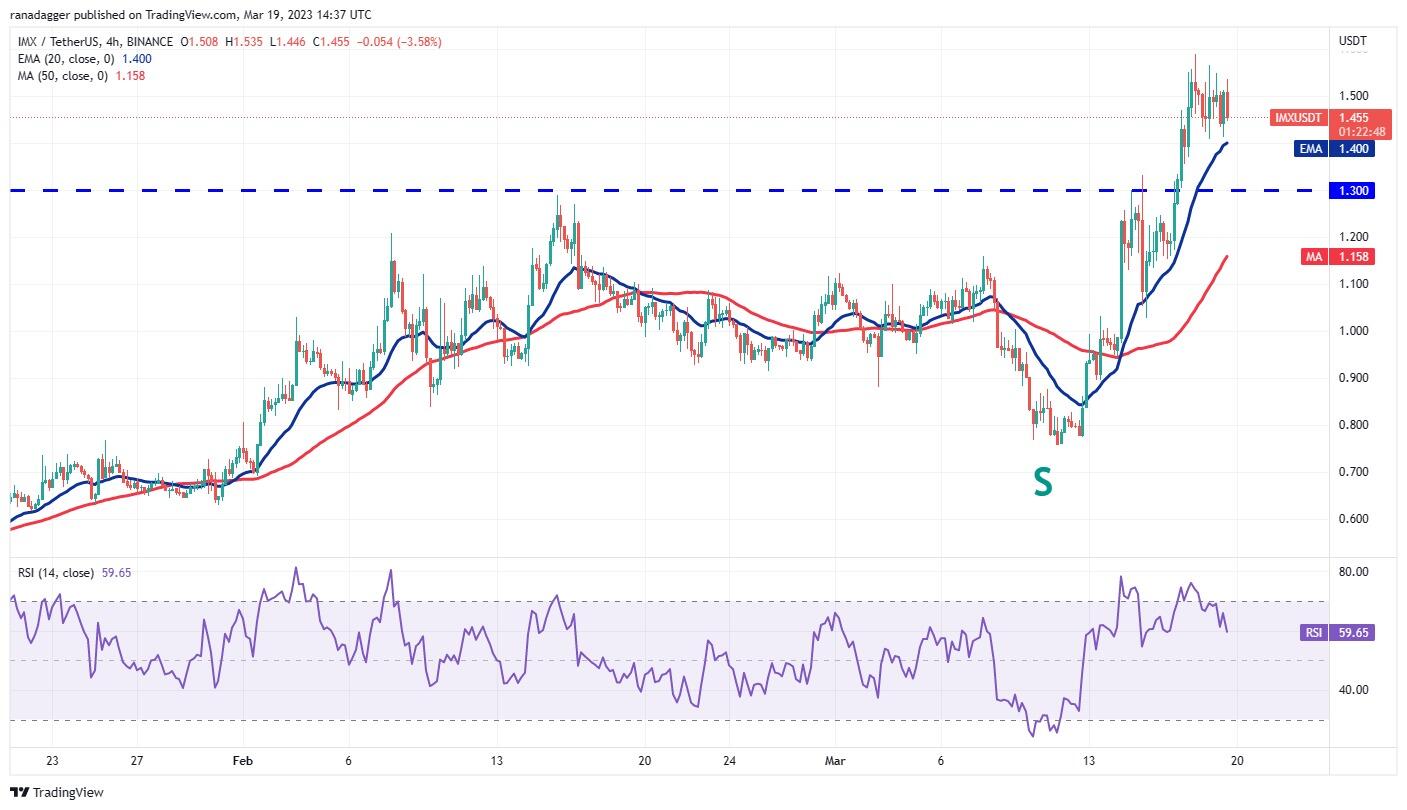
IMX/USDT 4-hour chart. Source: TradingView
The pair is witnessing a mild correction, which is finding support at the 20-EMA. Buyers are trying to clear the overhead hurdles at $1.59 but the bears are not relenting. If the price breaks below the 20-EMA, the pullback could reach $1.30.
Another possibility is that the price rebounds off the 20-EMA. That will indicate solid demand at lower levels and enhance the prospects of a break above $1.59. If that happens, the pair may resume its uptrend.
Author

Cointelegraph Team
Cointelegraph
We are privileged enough to work with the best and brightest in Bitcoin.


