These are the bullish targets for Polygon’s MATIC price rebound
- MATIC price has breached its downtrend as it recovered above a weekly support level at $0.381 and rallied higher.
- This bounce is likely to push Polygon up by 10% to retest the intermediate hurdle at $0.477.
- A four-hour candlestick close below $0.381 will invalidate the recovery thesis.

MATIC price shows an interesting development over the last week that has led it to where it is currently trading now. A combination of two key events has led the altcoin to kick-starting a recovery.
MATIC price launches
MATIC price has been trying to bottom since June 13, which resulted in a battle for control between buyers and sellers. The outcome was that Polygon formed three lower lows and three lower highs. The significant point was the swing low formed on June 19, as it was a reversal point.
Since then, MATIC price has rallied 38% to where it currently trades - $0.431. Interestingly, this recovery bounce is impressive due to one main reason - the formation of a bullish divergence.
The lower lows formed by MATIC price contrast with the higher lows formed by the Relative Strength Index (RSI). This setup is known as bullish divergence and forecasts an upswing for the underlying asset.
As seen, MATIC price did exactly that. Considering its current position, there is a chance for Polygon to continue this uptrend to $0.477. In total, this move would constitute a 10% ascent from the current positions.
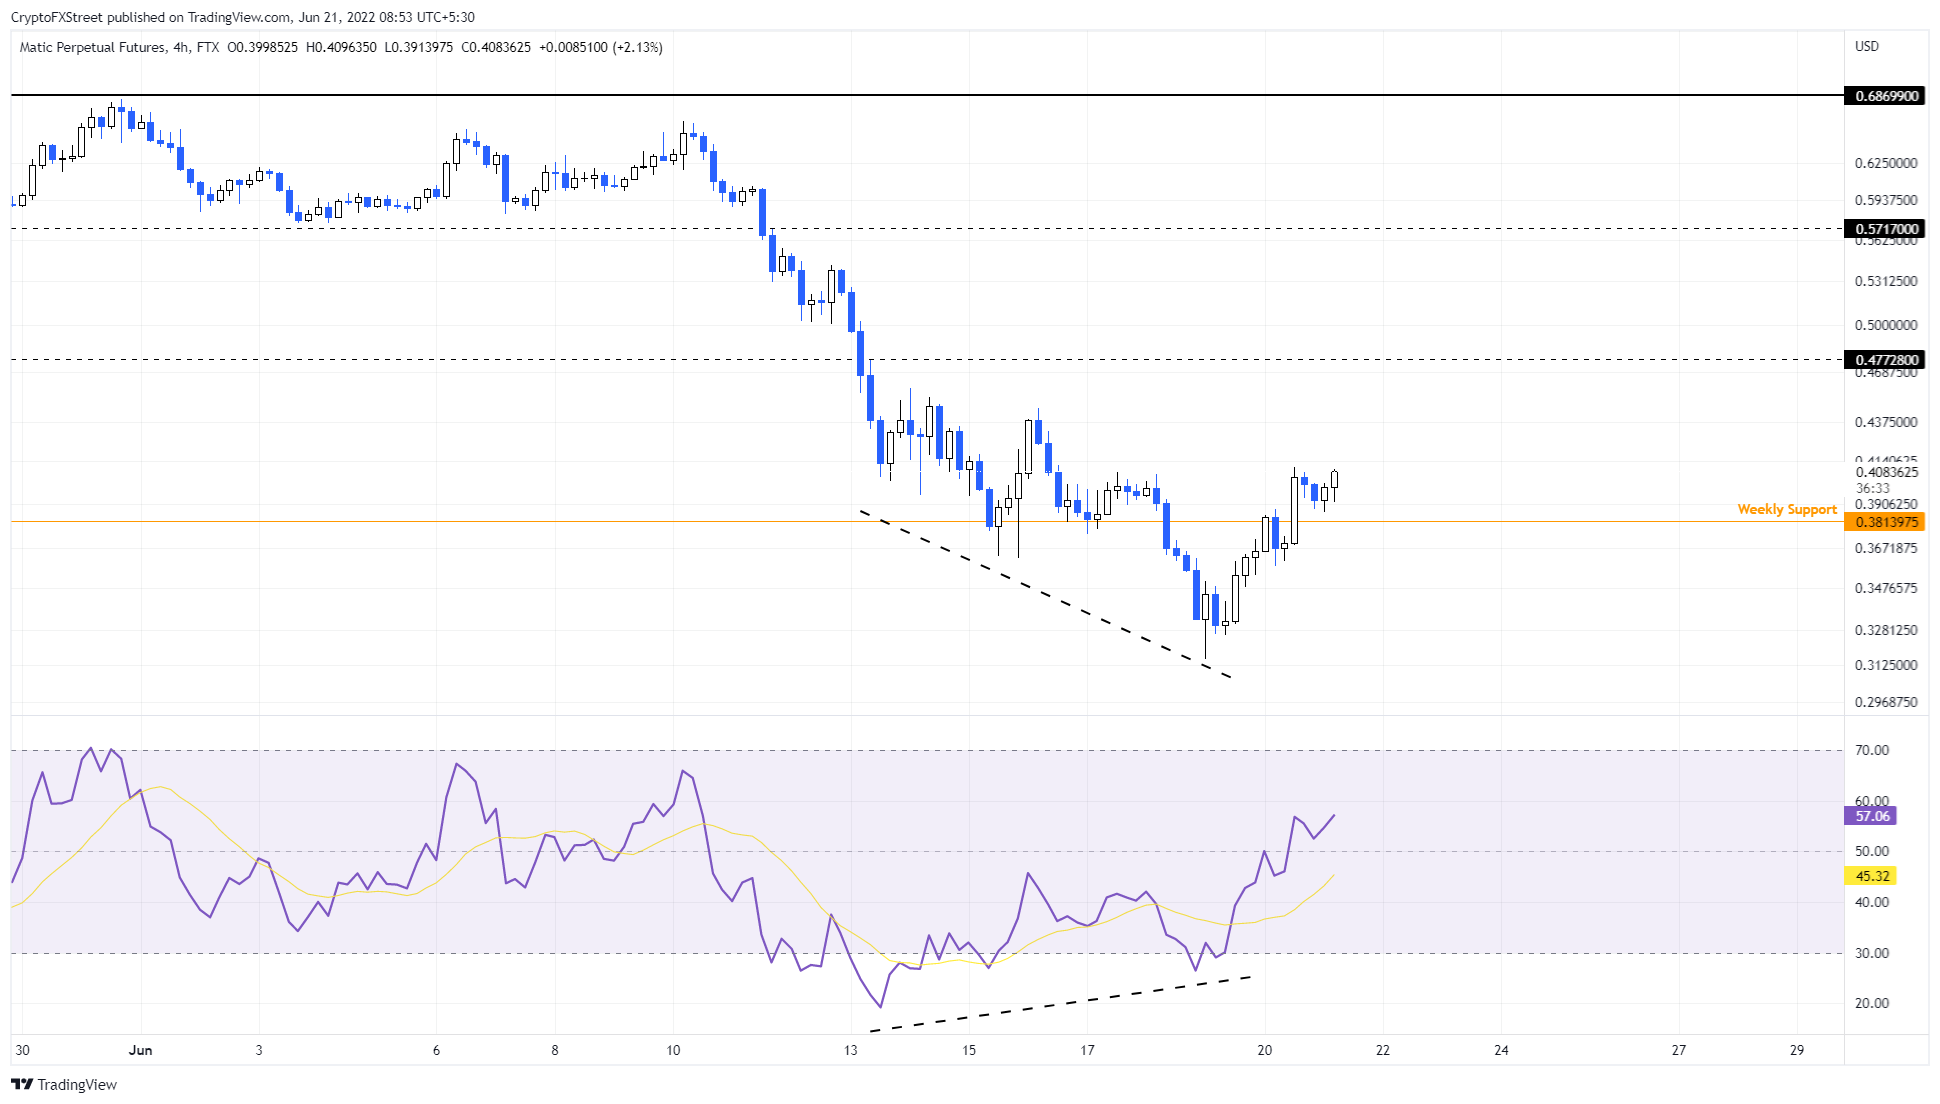
MATIC/USDT 4-hour chart
Despite the sluggish Bitcoin price action, MATIC price and other altcoins are bouncing aggressively. Nevertheless, a sudden spike in selling pressure that produces a four-hour candlestick close below the $0.381 weekly support level will invalidate the recovery thesis.
In such a situation, MATIC price could crash 38% and revisit the next foothold at $0.234.
Author

Akash Girimath
FXStreet
Akash Girimath is a Mechanical Engineer interested in the chaos of the financial markets. Trying to make sense of this convoluted yet fascinating space, he switched his engineering job to become a crypto reporter and analyst.


