Sandbox forms a bear trap with squeeze against $5
- The Sandbox looked ready to tanktowards $4.0, saw a bullish uptick instead.
- SAND pushes bears against the wall with stops hit at $5.0.
- A reversal confirmation would see a retest back to $5.68 and $6.50.

The Sandbox looked very heavy on Monday after a rejection near the $5.68 handle of what acts as a monthly pivot and saw price paring back to the downside. Although the SAND price broke below $4.72, bulls are stepping in and are squeezing bears out of their short-term entries by hitting stop levels at $5.0. As the selling pressure starts to fade, expect an uptick and return to $5.68 and test for re-entry above the green ascending trend line at $6.50.
The Sandbox hits stop orders from bears at $5.0
The Sandbox saw some choppy price action and rejected the upside from the monthly Pivot for December at $5.68. As bulls tried to bounce off the technical level at $4.72, price action paired back from barely hitting the monthly Pivot and broke below the technical support. Short-term bears entered on the break of that technical level and placed their stops above $4.72, which are getting hit this morning by bulls reclaiming the latter level.
With that bullish knee-jerk reaction, expect selling pressure to fade a little bit, opening up the door for bulls to push price action in SAND back to $5.68 at the monthly Pivot. A tailwind from some positive headlines could help lift sentiment and see a break above the monthly Pivot, with the next target a possible re-entry of the uptrend at the green ascending trendline near $6.5. If more positive news comes with a possible Christmas rally, expect even a run-up towards $8.0, with all stars aligned and markets going for full risk-on in these remaining last trading days of 2021.
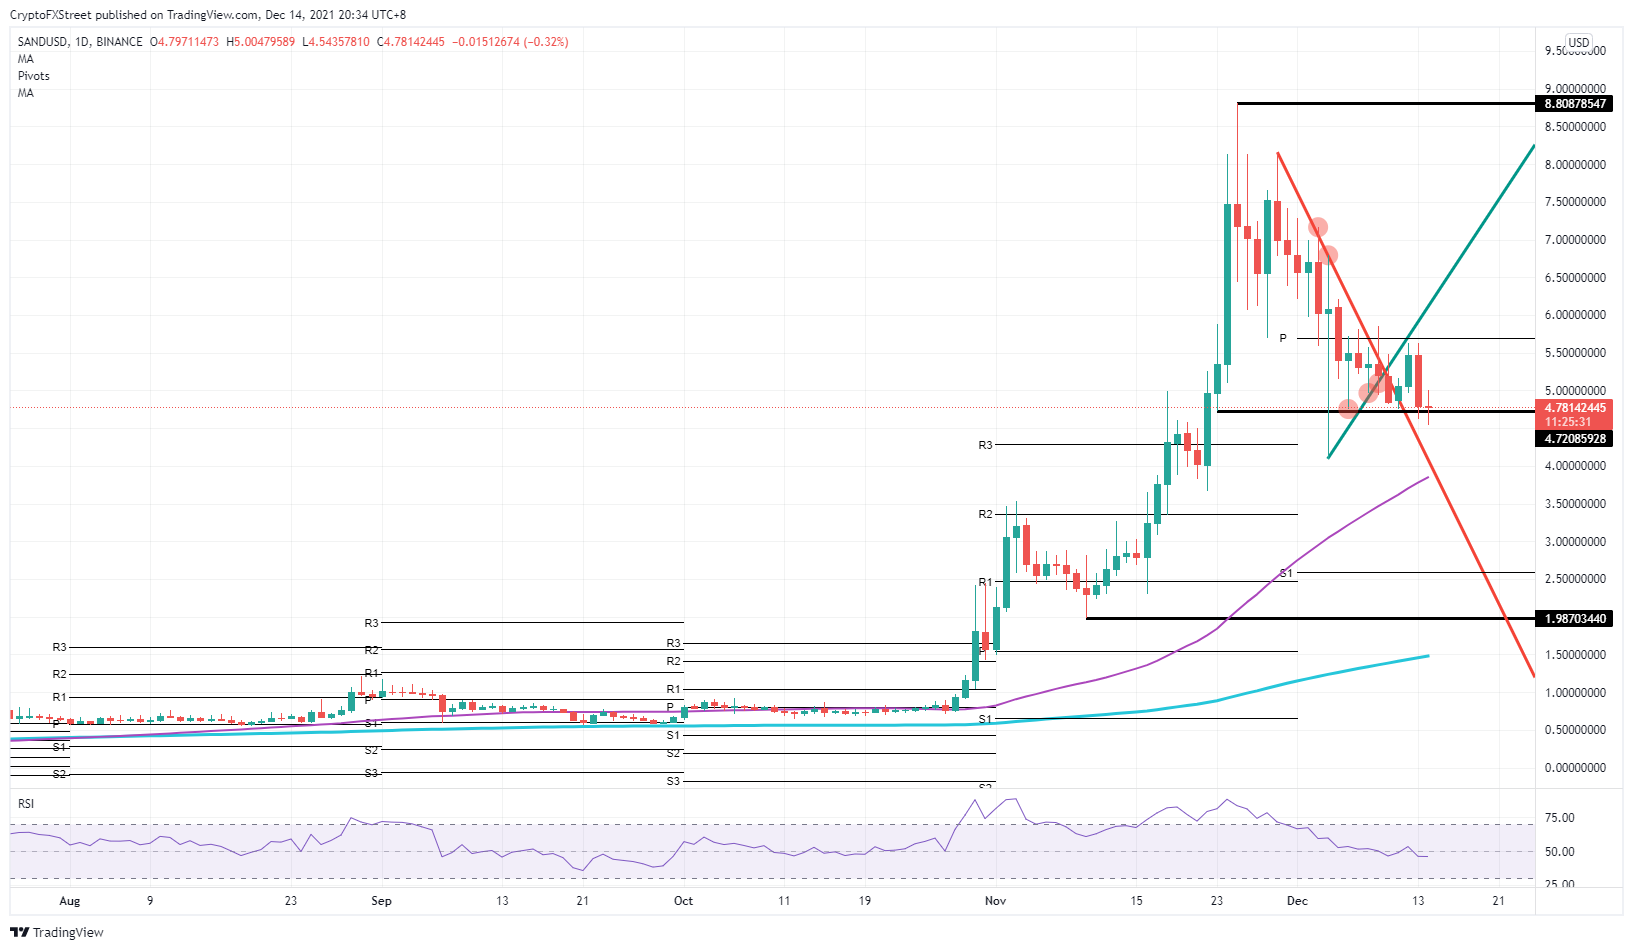
SAND/USD daily chart
Sentiment could shift to the downside with the event risk further this week as several central banks are scheduled to make their last monetary policy statement for 2021. With elevated levels in inflation and GDP overheating in several developed economies, expect some hawkish tones that could sour the mode and push investors to cash-only positions, pulling the plug on risky assets like stocks and cryptocurrencies. In that case, expect a nose dive reaction, breaking below the 55-day Simple Moving Average (SMA) at $3.82 and not coming to a halt before $2.50 with the monthly S1 support level.
Author

Filip Lagaart
FXStreet
Filip Lagaart is a former sales/trader with over 15 years of financial markets expertise under its belt.


