The rekt have been resurrected, here's where Solana price goes next
- Solana price ascends in stair-step fashion, as bulls breach through $35.
- SOL price witnesses a golden cross of the 8- and 21-day simple moving averages.
- Invalidation is a breach below the trend line currently positioned at $30.50.

Solana price recent incline could be the start of a larger move targeting $50.
Solana price shows bullish strength
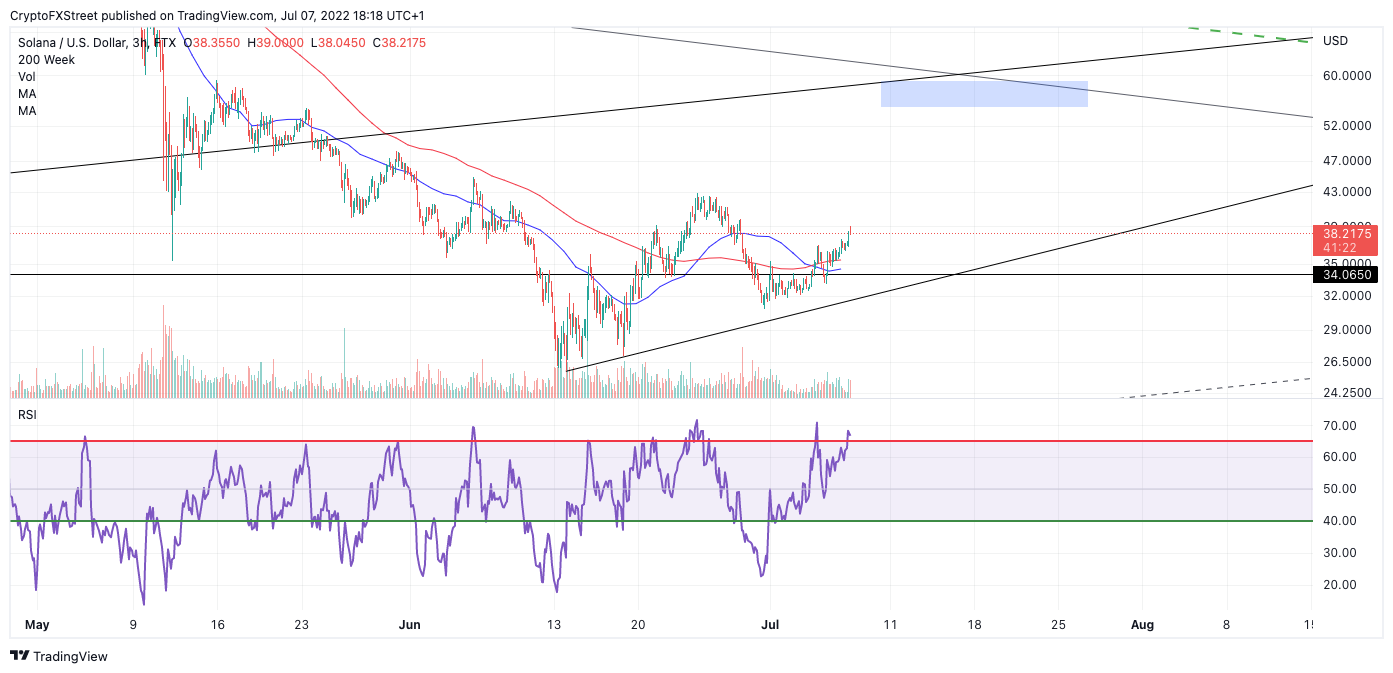
Solana price has begun an applaudable retaliation following the devastating sell off in spring. The bulls have established a 25% rally since the higher low at $31 was printed on the final day of June. Bulls in the market witnessed a justifiable entry signal on July 6, when a golden cross of the 8- and 21-day simple moving averages (SMAs) occurred. A liquidity hunt briefly occurred at $35 to shake out weak hands. What traders are witnessing now is traders FOMOing into the market who probably placed their initial trade’s invalidation level below the SMA's.
Solana price currently trades at $39 as consecutive bullish engulfing candles have been established on the 2-day chart. The Relative Strength Index (RSI) has shown an eye-candy-like signal as it perfectly bounced on the 50 levels after seeing its first spike into overbought territory. The indicator is now back in oversold territory, confirming that the breach above $35 is only the beginning. If market conditions persist, the Solana price should rally to $50 for an additional 30% gain.
SOL/USDT 3-Hour Chart
Invalidation of the bullish uptrend lies below the ascending trendline that connects the higher lows. At the current time, the invalidation point lines up at $30.50. If the bulls manage to breach this level, the uptrend will be entirely void. Traders should expect a decline into $20, resulting in a 45% decrease from the current Solana price.
Author

Tony M.
FXStreet Contributor
Tony Montpeirous began investing in cryptocurrencies in 2017. His trading style incorporates Elliot Wave, Auction Market Theory, Fibonacci and price action as the cornerstone of his technical analysis.


