- The Graph steadies after Saturday’s wild swings.
- The token trends in a symmetrical triangle on the 4H chart.
- The path of least resistance appears to the upside.
GRT/USD is trading in a narrow range so far this Sunday, consolidating Saturday’s good two-way businesses while holding above the $2 mark.
The Graph drew strong bids amid a broad buying wave seen across the crypto space, as Bitcoin reached an all-time-highs above $57,000 despite the world’s richest man, Elon Musk, tweet – “BTC & ETH do seem high.”
Earlier this week, the developers of The Graph said that “it’s just a matter of time before we begin to see even more institutional investors moving into platforms focused on Web 3.0, which is an evolving set of standards (mostly open-source) that aim to support the Internet of the future.”
Web 3.0 platforms will attract the same level of interest from institutions that Bitcoin is getting at the moment, the Graph team predicted.
GRT/USD: Awaits a triangle breakout amid favorable indicators
The four-chart of the Graph shows that the price is awaiting a breakout from the symmetrical triangle formation on either side.
Although the odds of an upside break appear convincing amid a stack of healthy support levels.
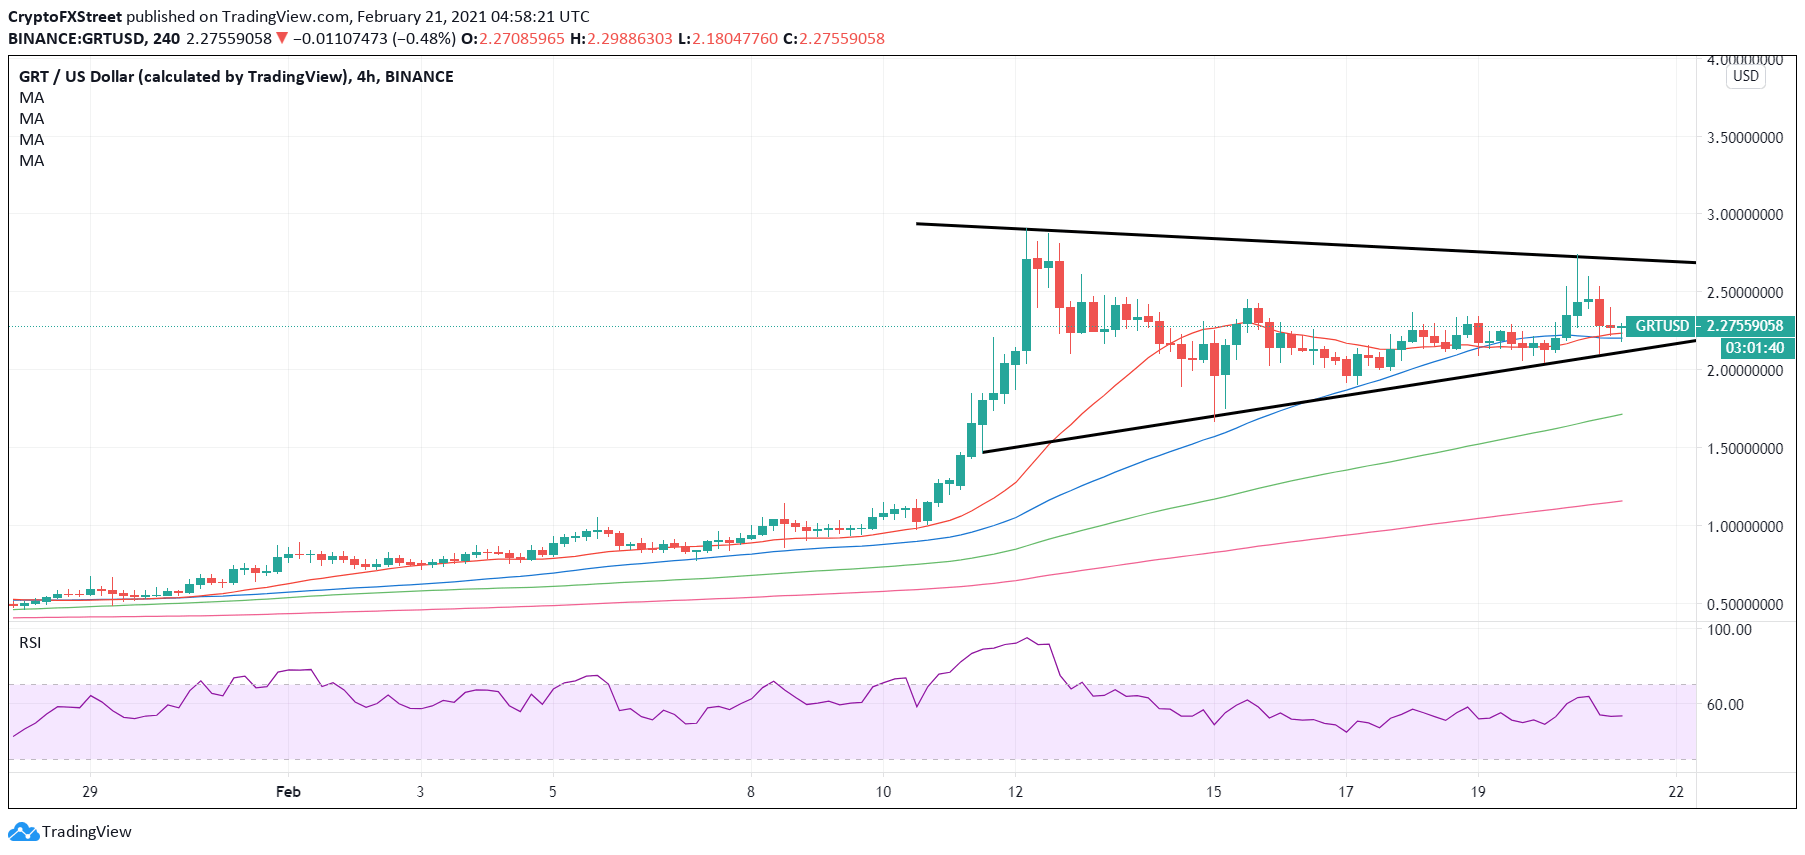
GRT/USD: Four-hour chart
The bull cross spotted in early Sunday dealing, with the 21-simle moving average (SMA) piercing the 50-SMA from below, remains supportive of the bullish bias.
GRT/USD needs to close above the falling trendline resistance at $2.70 on the four-hour candlestick to confirm a triangle breakout, opening doors for a retest of the record highs of $2.9072.
The psychological $3 level could challenge the bulls’ commitments. The relative strength index (RSI) is edging lower, as of writing, although trades above the 50 level, keeping the buyers hopeful.
Strong support around $2.20 is likely to limit the downside attempts. A sustained move below the falling trendline support at $2.11 could yield a downside break.
The next relevant cushion awaits at the rising 100-SMA at $1.7155.
Information on these pages contains forward-looking statements that involve risks and uncertainties. Markets and instruments profiled on this page are for informational purposes only and should not in any way come across as a recommendation to buy or sell in these assets. You should do your own thorough research before making any investment decisions. FXStreet does not in any way guarantee that this information is free from mistakes, errors, or material misstatements. It also does not guarantee that this information is of a timely nature. Investing in Open Markets involves a great deal of risk, including the loss of all or a portion of your investment, as well as emotional distress. All risks, losses and costs associated with investing, including total loss of principal, are your responsibility. The views and opinions expressed in this article are those of the authors and do not necessarily reflect the official policy or position of FXStreet nor its advertisers. The author will not be held responsible for information that is found at the end of links posted on this page.
If not otherwise explicitly mentioned in the body of the article, at the time of writing, the author has no position in any stock mentioned in this article and no business relationship with any company mentioned. The author has not received compensation for writing this article, other than from FXStreet.
FXStreet and the author do not provide personalized recommendations. The author makes no representations as to the accuracy, completeness, or suitability of this information. FXStreet and the author will not be liable for any errors, omissions or any losses, injuries or damages arising from this information and its display or use. Errors and omissions excepted.
The author and FXStreet are not registered investment advisors and nothing in this article is intended to be investment advice.
Recommended Content
Editors’ Picks

IRS says crypto staking should be taxed in response to lawsuit
The IRS stated that rewards from cryptocurrency staking are taxable upon receipt, according to a Bloomberg report on Monday, which stated the agency rejected a legal argument that sought to delay taxation until such rewards are sold or exchanged.
Solana dominates Bitcoin, Ethereum in price performance and trading volume: Glassnode
Solana is up 6% on Monday following a Glassnode report indicating that SOL has seen more capital increase than Bitcoin and Ethereum. Despite the large gains suggesting a relatively heated market, SOL could still stretch its growth before establishing a top for the cycle.
Ethereum Price Forecast: ETH risks a decline to $3,000 as investors realize increased profits and losses
Ethereum is up 4% on Monday despite increased selling pressure across long-term and short-term holders in the past two days. If whales fail to maintain their recent buy-the-dip attitude, ETH risks a decline below $3,000.

Crypto Today: BTC hits new Trump-era low as Chainlink, HBAR and AAVE lead market recovery
The global cryptocurrency market cap shrank by $500 billion after the Federal Reserve's hawkish statements on December 17. Amid the market crash, Bitcoin price declined 7.2% last week, recording its first weekly timeframe loss since Donald Trump’s re-election.

Bitcoin: 2025 outlook brightens on expectations of US pro-crypto policy
Bitcoin price has surged more than 140% in 2024, reaching the $100K milestone in early December. The rally was driven by the launch of Bitcoin Spot ETFs in January and the reduced supply following the fourth halving event in April.

Best Forex Brokers with Low Spreads
VERIFIED Low spreads are crucial for reducing trading costs. Explore top Forex brokers offering competitive spreads and high leverage. Compare options for EUR/USD, GBP/USD, USD/JPY, and Gold.