• The Graph price crashed 35% since March 9 as it approaches the lower trendline of a horizontal parallel channel.
  • The sell-off might continue if the crucial demand zone ranging from $1.5 to $1.45 is breached.
  • Declining network activity and growth suggest a bearish outcome for GRT.

The Graph price will face a decision as it slides towards a confluence of support. Based on GRT’s reaction here, it could either surge higher or enter a corrective phase.

The Graph price at crossroads

The Graph price has suffered a bearish fate ever since it hit a new all-time high of $2.89 on February 12. Since this point, GRT has pulled back nearly 55% and is currently trading around the $1.52 level.

However, the Graph price’s clockwork-like price movement since February 23 has formed two swing highs around $2.11 and three swing lows near the $1.50 level.

A horizontal parallel channel evolves when the pivot points are connected using trend lines. This pattern does not have an inherent bias, and hence, the breakout isn’t confirmed. 

A bearish breakdown of the setup forecasts a 30% downswing to $1.05, determined by adding the channel’s height to the breakout point at $1.50.

GRT/USDT 12-hour chart

GRT/USDT 12-hour chart

Adding credence to this bearish outlook is the contrast between the overhead barriers and support levels for the Graph price portrayed by IntoTheBlock’s In/Out of the Money Around Price (IOMAP) model.

IOMAP cohorts reveal that roughly 460 addresses purchased 18.17 million GRT at an average price of $1.47. So, a sudden spike in bearish pressure leading to a decisive close below this level could trigger a sell-off from panicking investors, further supporting the pessimistic outcome for GRT.
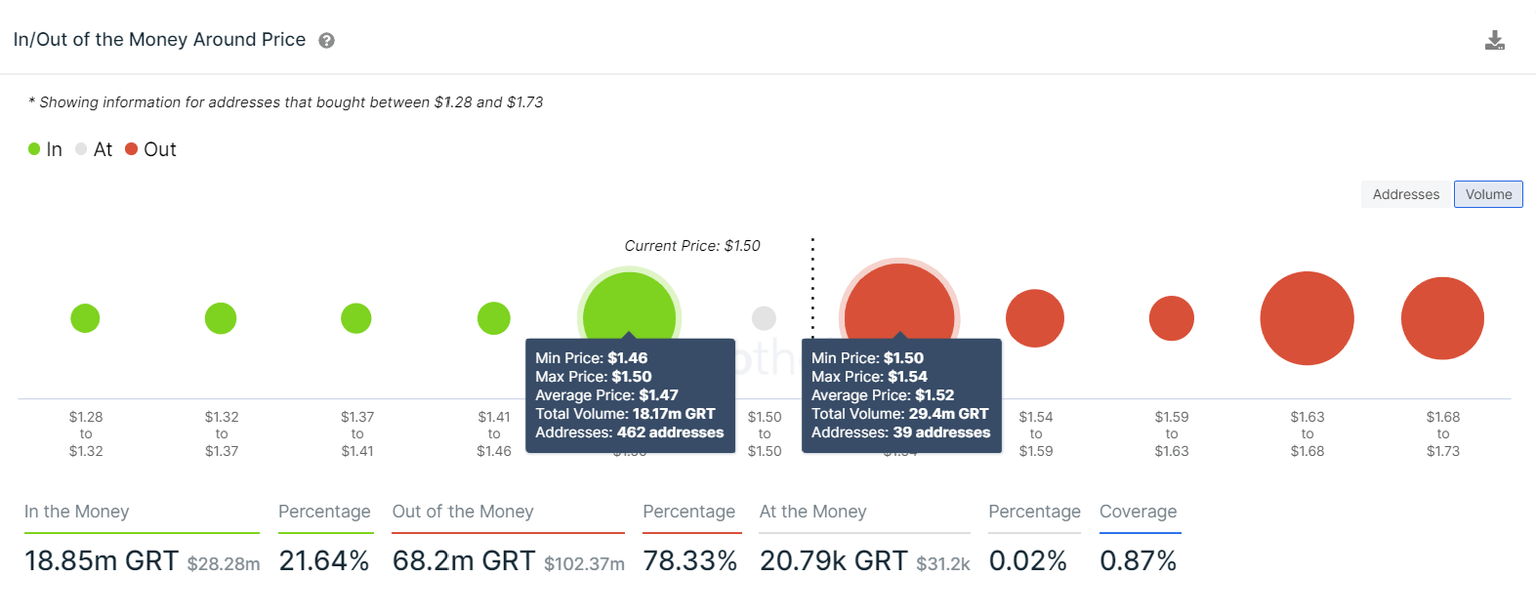
The Graph IOMAP

The Graph IOMAP

The daily active addresses transacting on the GRT blockchain reduced from 7,326 to 1,554, a 78% drop in the number of unique addresses. This reduction signifies investors’ disinterest or fleeing capital, which paints a bearish picture for the Graph price.

Likewise, the network growth metric, which tracks the blockchain’s user adoption, has declined 80% since February 12, adding to the already grim outlook for GRT.

The Graph Network Growth and Daily Active addresses chart

The Graph Network Growth and Daily Active addresses chart

However, considering Momentum Reversal Indicator’s (MRI) breakout line at $1.45, a bounce seems likely. Adding credence to this upside move is the presence of the 50% Fibonacci retracement level around $1.49, coinciding with the setup’s lower trend line.

Hence, this confluence of support ranges from $1.5 to $1.45, provides stable grounds for a lift-off. Therefore, a spike in buying pressure could propel the Graph price by almost 19% to the horizontal parallel channel’s middle line at $1.78.

A 22% upswing to the upper boundary at $2.11 seems likely if the bullish momentum persists.


Information on these pages contains forward-looking statements that involve risks and uncertainties. Markets and instruments profiled on this page are for informational purposes only and should not in any way come across as a recommendation to buy or sell in these assets. You should do your own thorough research before making any investment decisions. FXStreet does not in any way guarantee that this information is free from mistakes, errors, or material misstatements. It also does not guarantee that this information is of a timely nature. Investing in Open Markets involves a great deal of risk, including the loss of all or a portion of your investment, as well as emotional distress. All risks, losses and costs associated with investing, including total loss of principal, are your responsibility. The views and opinions expressed in this article are those of the authors and do not necessarily reflect the official policy or position of FXStreet nor its advertisers. The author will not be held responsible for information that is found at the end of links posted on this page.

If not otherwise explicitly mentioned in the body of the article, at the time of writing, the author has no position in any stock mentioned in this article and no business relationship with any company mentioned. The author has not received compensation for writing this article, other than from FXStreet.

FXStreet and the author do not provide personalized recommendations. The author makes no representations as to the accuracy, completeness, or suitability of this information. FXStreet and the author will not be liable for any errors, omissions or any losses, injuries or damages arising from this information and its display or use. Errors and omissions excepted.

The author and FXStreet are not registered investment advisors and nothing in this article is intended to be investment advice.

Join Telegram

Recommended content


Recommended Content

Editors’ Picks

Ripple on-chain metrics show bullish signs amidst legal struggle with SEC, XRP eyes recovery

Ripple on-chain metrics show bullish signs amidst legal struggle with SEC, XRP eyes recovery

Ripple made a comeback above $0.48 on Tuesday and hovers above that level in Wednesday’s European session. Ripple on-chain metrics such as transaction volume and Network Realized Profit/Loss have turned bullish, supporting a recovery in the altcoin. 

More Ripple News

Bitcoin price falls amidst German government transfers, miners activity

Bitcoin price falls amidst German government transfers, miners activity

Bitcoin (BTC) extends correction on Wednesday and hovers around $61,000 after finding resistance near the $64,000 level on Monday. Recent on-chain data indicates heightened selling activity from Bitcoin miners early in the week. 

More Bitcoin News

Crypto Today: Bitcoin erases gains from end of June, Ethereum declines while Ripple holds

Crypto Today: Bitcoin erases gains from end of June, Ethereum declines while Ripple holds

Bitcoin wipes out gains from the last week of June and falls below $60,000 on Wednesday. Ethereum and top altcoins ranked by market capitalization erased gains as the inflation outlook worsened. Ripple holds on to recent gains and hovers above $0.48 on Wednesday. 

More Cryptocurrencies News

Three reasons why altcoins could shake off losses this week

Three reasons why altcoins could shake off losses this week

On-chain data from Santiment shows that altcoins are currently in the opportunity zone, or generating buy signals. The top three altcoins in the buy zone are Basic Attention Token (BAT), Chromia (CHR), and Highstreet (HIGH), per Santiment. 

More Altcoins News

Bitcoin: BTC price correction could end in July, according to seasonal data

Bitcoin: BTC price correction could end in July, according to seasonal data

Bitcoin (BTC) price appears poised for a decline this week, influenced by slight outflows in US spot ETFs, selling activity among BTC miners, and a combined transfer of 4,690.28 BTC to centralized exchanges by the US and German governments.

Read full analysis

BTC

ETH

XRP