The Graph Price Forecast: GRT risks freefall under $1 amid broad-based crypto declines
- The Graph has lost two key support levels, including the 100 SMA on the 4-hour chart.
- A fall in the new addresses joining the network adds credence to the bearish picture.
- Closing the day above the middle layer of the channel will pave the way for gains above $2.5.

The Graph is teetering at $1.73 after its uptrend ran into a barrier around $2.9. Declines have been consistent within the confines of a descending parallel channel. Losing the middle boundary support has left GRT bears with open-air to explore.
The Graph correction gaining momentum
The drop in the token's value is not unique to The Graph because larger coins like Bitcoin and Ethereum have been affected. The Graph seems to have engaged higher reverse gears on losing support at the 50 Simple Moving Average (SMA). Declines increased momentum, forcing the price to slice through the descending channel's middle boundary and the 100 SMA on the 4-hour chart.
At the time of writing, GRT is doddering at $1.74 amid the bulls' fight to sustain the price above the channel's lower edge. However, declines are likely to continue based on the Moving Average Convergence Divergence (MACD). The technical indicator has plunged into the negative territory, and in addition to that, the MACD line (blue) crossed under the signal line, in turn validating the bearish outlook.
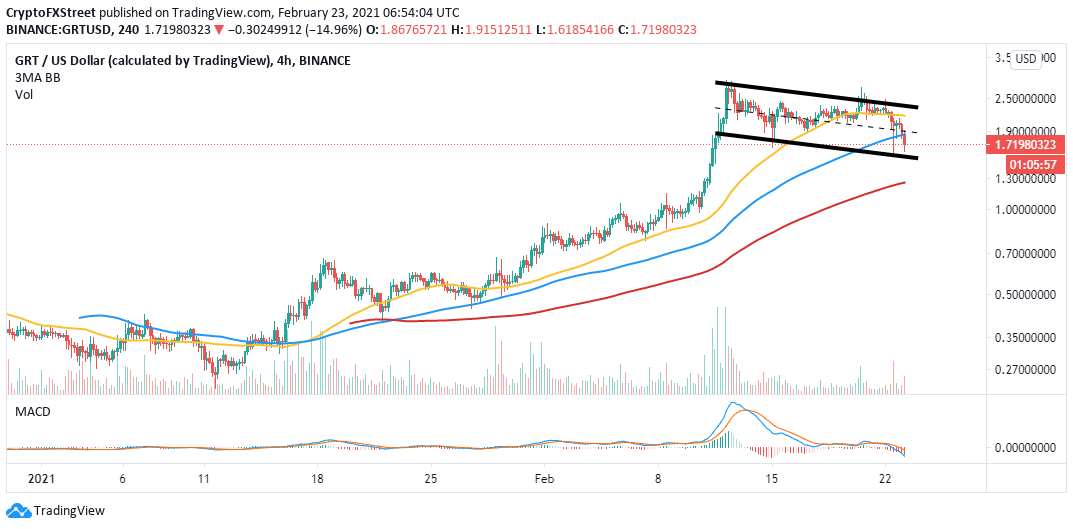
GRT/USD 4-hour chart
Note that a break under the channel's lower boundary will trigger massive declines as The Graph falls toward $1. The 200 SMA on the same 4-hour chart is in line to offer support and prevent GRT from falling sharply.
According to IntoTheBlock's "Daily New Addresses" model, The Graph's network growth has been falling over the last couple of weeks. The number of newly-created addresses topped out at nearly 4,400 on February 12 but has declined to 1,500 at the time of writing, representing a 66% drop.
Declining network growth is a bearish signal mainly because it interferes with the inflow and outflow of tokens within the protocol. Moreover, if these unique addresses fail to recover, the token's mainstream adoption will be affected.
-637496623597618262.png)
The Graph new addresses chart
Looking at the other side of the fence
The short-term analysis is bearish regarding The Graph. However, holding within the descending channel will ensure that stability returns to the market. Simultaneously, a recovery past the 100 SMA and the channel's middle boundary will open the door for restoration mission staged by the bulls, eyeing gains toward $2.5 and $3, respectively.
Author

John Isige
FXStreet
John Isige is a seasoned cryptocurrency journalist and markets analyst committed to delivering high-quality, actionable insights tailored to traders, investors, and crypto enthusiasts. He enjoys deep dives into emerging Web3 tren