The Graph Price Forecast: GRT opens Pandora’s Box as technicals tease 47% downswing
- The Graph commences potentially massive freefall after breaking under the descending triangle.
- Immense resistance highlighted by the IOMAP reveals that significant recovery is doubtful in the short term.
- The MVRV ratio shows that GRT has reset to the buy zone ahead of another upswing.

The Graph has been caught up in the bearish wave sweeping across the cryptocurrency market. In addition to its upside limited by a descending trendline, losses intensified as soon as the price sliced through the support at $1.7. The losses seem unstoppable, especially with GRT having lost a key technical pattern’s support.
The Graph stares into the abyss amid looming declines
The Graph is exchanging hands at $1.36 at the time of writing. The freefall from highs above $1.7 failed to hold onto the tentative support provided by the 50 Simple Moving Average (SMA) on the 4-hour chart. Continued losses saw GRT slip under a descending parallel channel.
The descending triangle is an extremely bearish pattern. Breaking below the triangle support usually culminates in massive losses, with a target equal to the distance between the pattern’s highest and lowest points. Therefore, if short-term support at $1.13 fails to hold, The Graph may plunge under $1 and test the primary support at $0.75.
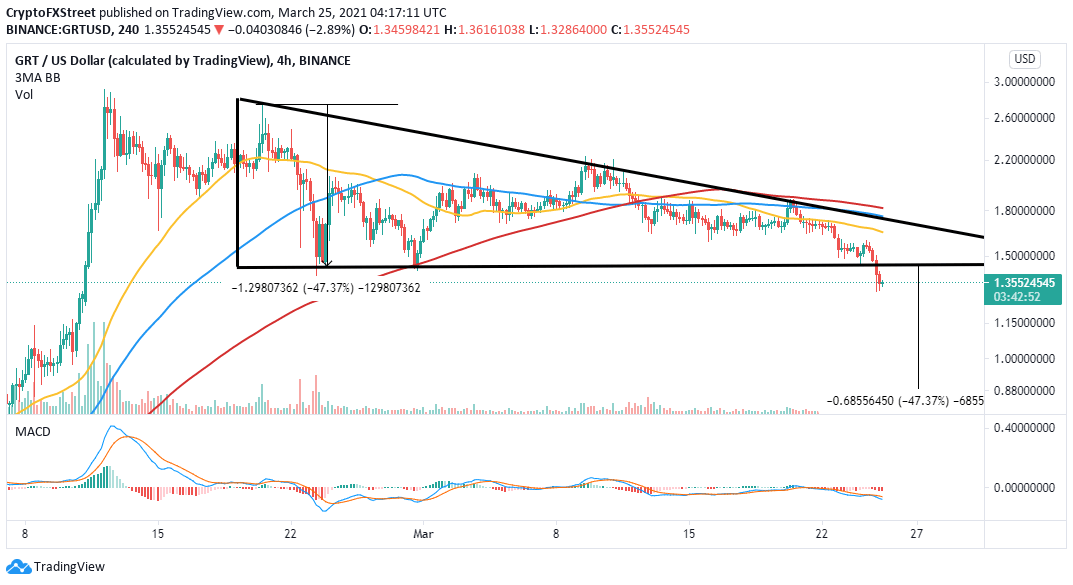
GRT/USD 4-hour chart
The IOMAP chart by IntoTheBlock confirms that recovery will be an uphill battle. Intense resistance has been illustrated between $1.48 and $1.52. Here, 557 addresses had previously scooped up around 32.2 million GRT.
On the flip side, the absence of formidable support emphasizes the possibility of the triangle pattern’s target occurring. However, the model brings our attention to the region running from $1.2 to $1.24, where 52 addresses had previously bundled up roughly 2.2 million GRT.
-637522467904760774.png)
The Graph IOMAP model
Looking at the other side of the fence
The MVRV on-chain metric by Santiment reveals that The Graph is once again in a buy zone. This model tracks the profit or loss of GRT holders based on all the tokens moved over the last 30 days compared to the time each token moved previously.
%20[07.56.21,%2025%20Mar,%202021]-637522467843563253.png)
The Graph MVRV model
An MVRV ratio of more than 1% shows that investors are in profit. Note that the higher the ratio, the more investors are likely to sell. However, a 1% or below ratio shows that investors are at a loss or are yet to break even.
Therefore, holding becomes a strategy as they wait for the price to rise. This greatly decreases the selling pressure and could place GRT on an upward roll to higher levels.
Author

John Isige
FXStreet
John Isige is a seasoned cryptocurrency journalist and markets analyst committed to delivering high-quality, actionable insights tailored to traders, investors, and crypto enthusiasts. He enjoys deep dives into emerging Web3 tren


