- Polkadot price has created a double bottom at $5.95 and hints at a potential reversal.
- Although a 45% upswing to $9.35 seems likely, investors must prepare for a potential sweep of $5.95 first.
- A daily candlestick close below $5.95 will create a lower low and invalidate the bullish scenario for DOT.
Polkadot price has been hovering below a previously formed range for quite some time. The recent venture below a level has led to a bottom reversal formation that could result in a swift rally. Investors could get a window to purchase DOT at a discount.
Polkadot price builds up the momentum
Polkadot price formed a range, extending from $6.85 to $11.86 as it rallied roughly 72% between May 12 and 16. This explosive move set the stage for the price action to come for months.
Since May 12, DOT has deviated below the range low twice and has set up a double bottom at $5.95. While this technical formation is bullish and forecasts an 82% run-up to $11.86, the upward tracjectory is likely to be uneven.
The most obvious scenario would include DOT flipping above the range low at $6.85, which will be the first bullish confirmation. Beyond this level, Polkadot price could attempt a retest of the range’s midpoint at $9.35, which would constitute a 45% gain from $6.43.
While the aforementioned outlook is logical, it is unlikely since Bitcoin price has no directional bias and is undergoing a range tightening. Therefore, investors should be open for a potential sweep of the $5.95 level to collect the sell-stop liquidity before a revisit of $9.35.
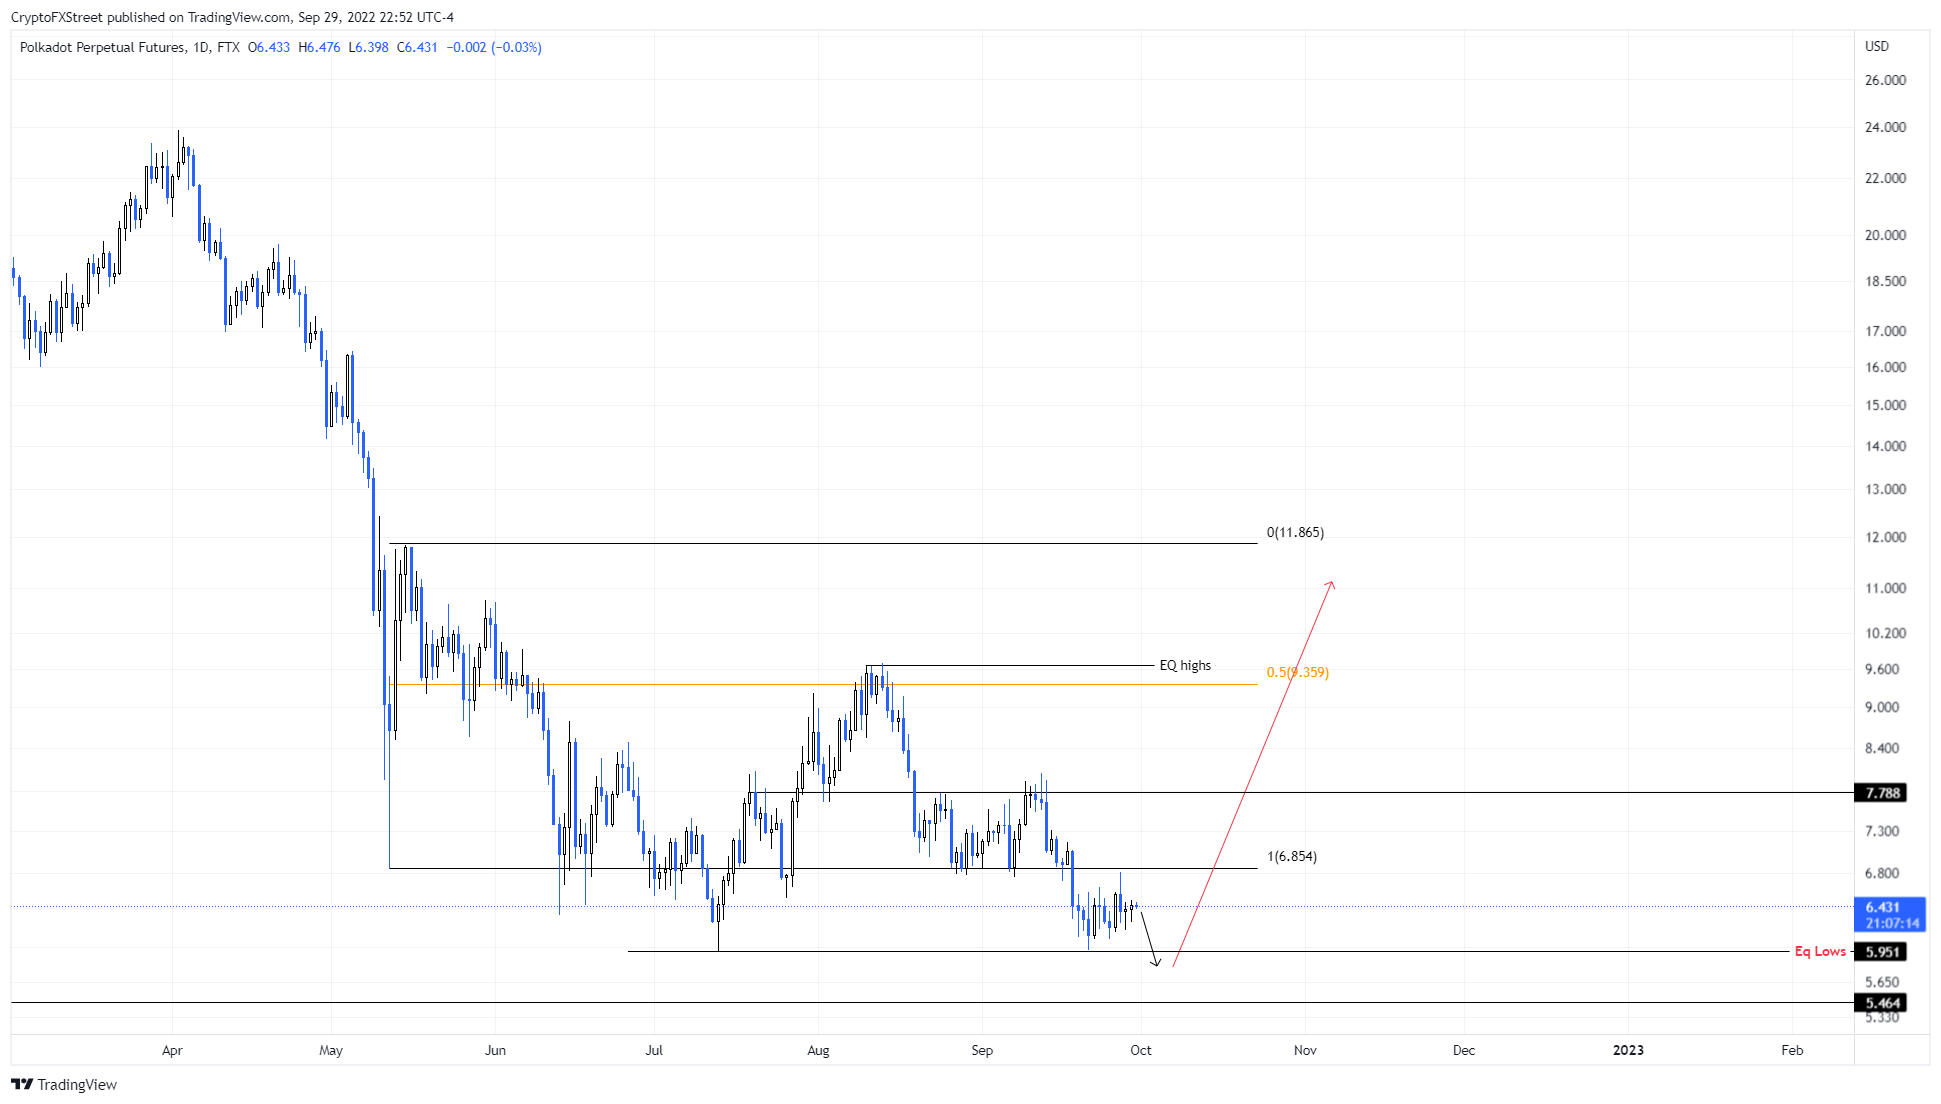
DOT/USDT 4-hour chart
While things are looking up for Polkadot price, a U-turn in Bitcoin price could ruin the perfectly bullish setup on DOT. Therefore, investors need to keep a close eye on the $5.95 level. A daily candlestick close below this level would create a lower low and invalidate the double bottom narrative.
This development would also invalidate bullish scenario and potentially trigger a further crash in Polkadot price to $5.46.
Note:
The video attached below talks about Bitcoin price and its potential outlook, however, this is still relevant as it is likely to influence Polkadot price
Information on these pages contains forward-looking statements that involve risks and uncertainties. Markets and instruments profiled on this page are for informational purposes only and should not in any way come across as a recommendation to buy or sell in these assets. You should do your own thorough research before making any investment decisions. FXStreet does not in any way guarantee that this information is free from mistakes, errors, or material misstatements. It also does not guarantee that this information is of a timely nature. Investing in Open Markets involves a great deal of risk, including the loss of all or a portion of your investment, as well as emotional distress. All risks, losses and costs associated with investing, including total loss of principal, are your responsibility. The views and opinions expressed in this article are those of the authors and do not necessarily reflect the official policy or position of FXStreet nor its advertisers. The author will not be held responsible for information that is found at the end of links posted on this page.
If not otherwise explicitly mentioned in the body of the article, at the time of writing, the author has no position in any stock mentioned in this article and no business relationship with any company mentioned. The author has not received compensation for writing this article, other than from FXStreet.
FXStreet and the author do not provide personalized recommendations. The author makes no representations as to the accuracy, completeness, or suitability of this information. FXStreet and the author will not be liable for any errors, omissions or any losses, injuries or damages arising from this information and its display or use. Errors and omissions excepted.
The author and FXStreet are not registered investment advisors and nothing in this article is intended to be investment advice.
Recommended Content
Editors’ Picks
Ripple on-chain metrics show bullish signs amidst legal struggle with SEC, XRP eyes recovery
Ripple made a comeback above $0.48 on Tuesday and hovers above that level in Wednesday’s European session. Ripple on-chain metrics such as transaction volume and Network Realized Profit/Loss have turned bullish, supporting a recovery in the altcoin.
Bitcoin price falls amidst German government transfers, miners activity
Bitcoin (BTC) extends correction on Wednesday and hovers around $61,000 after finding resistance near the $64,000 level on Monday. Recent on-chain data indicates heightened selling activity from Bitcoin miners early in the week.
Crypto Today: Bitcoin erases gains from end of June, Ethereum declines while Ripple holds
Bitcoin wipes out gains from the last week of June and falls below $60,000 on Wednesday. Ethereum and top altcoins ranked by market capitalization erased gains as the inflation outlook worsened. Ripple holds on to recent gains and hovers above $0.48 on Wednesday.
Three reasons why altcoins could shake off losses this week
On-chain data from Santiment shows that altcoins are currently in the opportunity zone, or generating buy signals. The top three altcoins in the buy zone are Basic Attention Token (BAT), Chromia (CHR), and Highstreet (HIGH), per Santiment.
Bitcoin: BTC price correction could end in July, according to seasonal data
Bitcoin (BTC) price appears poised for a decline this week, influenced by slight outflows in US spot ETFs, selling activity among BTC miners, and a combined transfer of 4,690.28 BTC to centralized exchanges by the US and German governments.