- Tezos price trades within an ascending channel, hinting at a potential surge of more than 20% if it can close above critical resistance.
- The digital asset's possibility to revisit the $3 level will become more pronounced if the above scenario plays out.
Tezos has been trading inside an ascending channel for two weeks. A successful breach of the overhead resistance could mean an easy upswing of over 20% that allows XTZ to recover lost ground.
Tezos' make or break moment
The $2.42 resistance level is crucial to Tezos' uptrend because it is a confluence of horizontal supply barriers that the price has tested more than four times in less than two months. It represents the upper boundary of an ascending channel where the digital asset has been contained within this period.
XTZ price needs buying pressure to flip this resistance wall into support. Doing so will likely be seen as a break out of the channel with a potential target of $2.90.
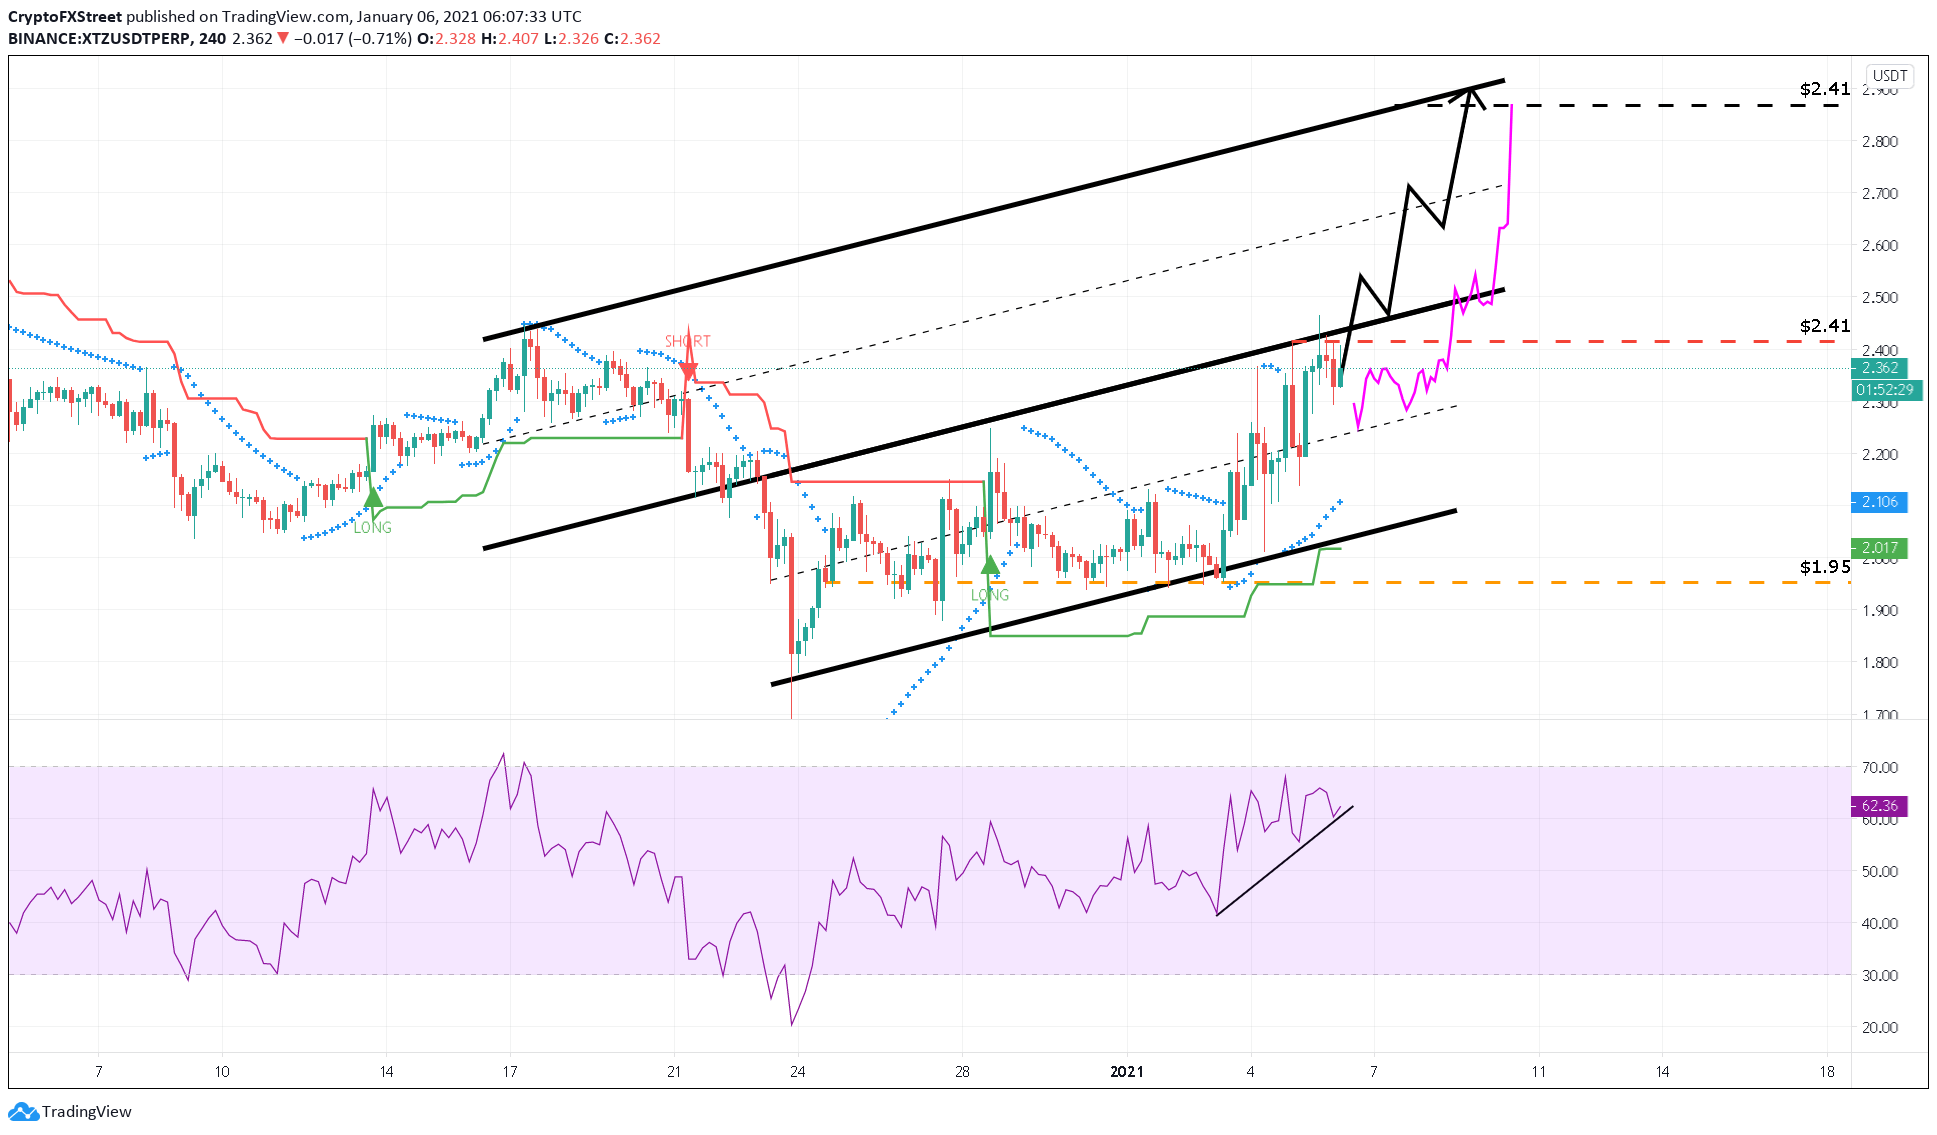
XTZ/USD 4-hour chart
The Parabolic SAR indicator adds credence to the bullish outlook. This technical index recently moved below Tezos price on the 4-hour chart, indicating that the overall trend remains bullish.
Moreover, the RSI indicator shows the formation of higher lows while it sits below overbought territory. Such an optimistic development suggests that Tezos price has more room to move higher, especially when considering that the SuperTrend flashed a buy signal in late December.
Multiple scenarios for the smart contracts token
Although Tezos does look bullish, there are different ways how the price could react to the $2.42 resistance level.
One of them suggests that Tezos price will flip the $2.42-level, bounce off the channel's upper boundary, and head higher, as shown by the chart's black path line. On the other hand, XTZ may continue to head lower only to bounce off the channel's middle line and then proceed to flip the overhead resistance level and hit its intended target of $2.90.
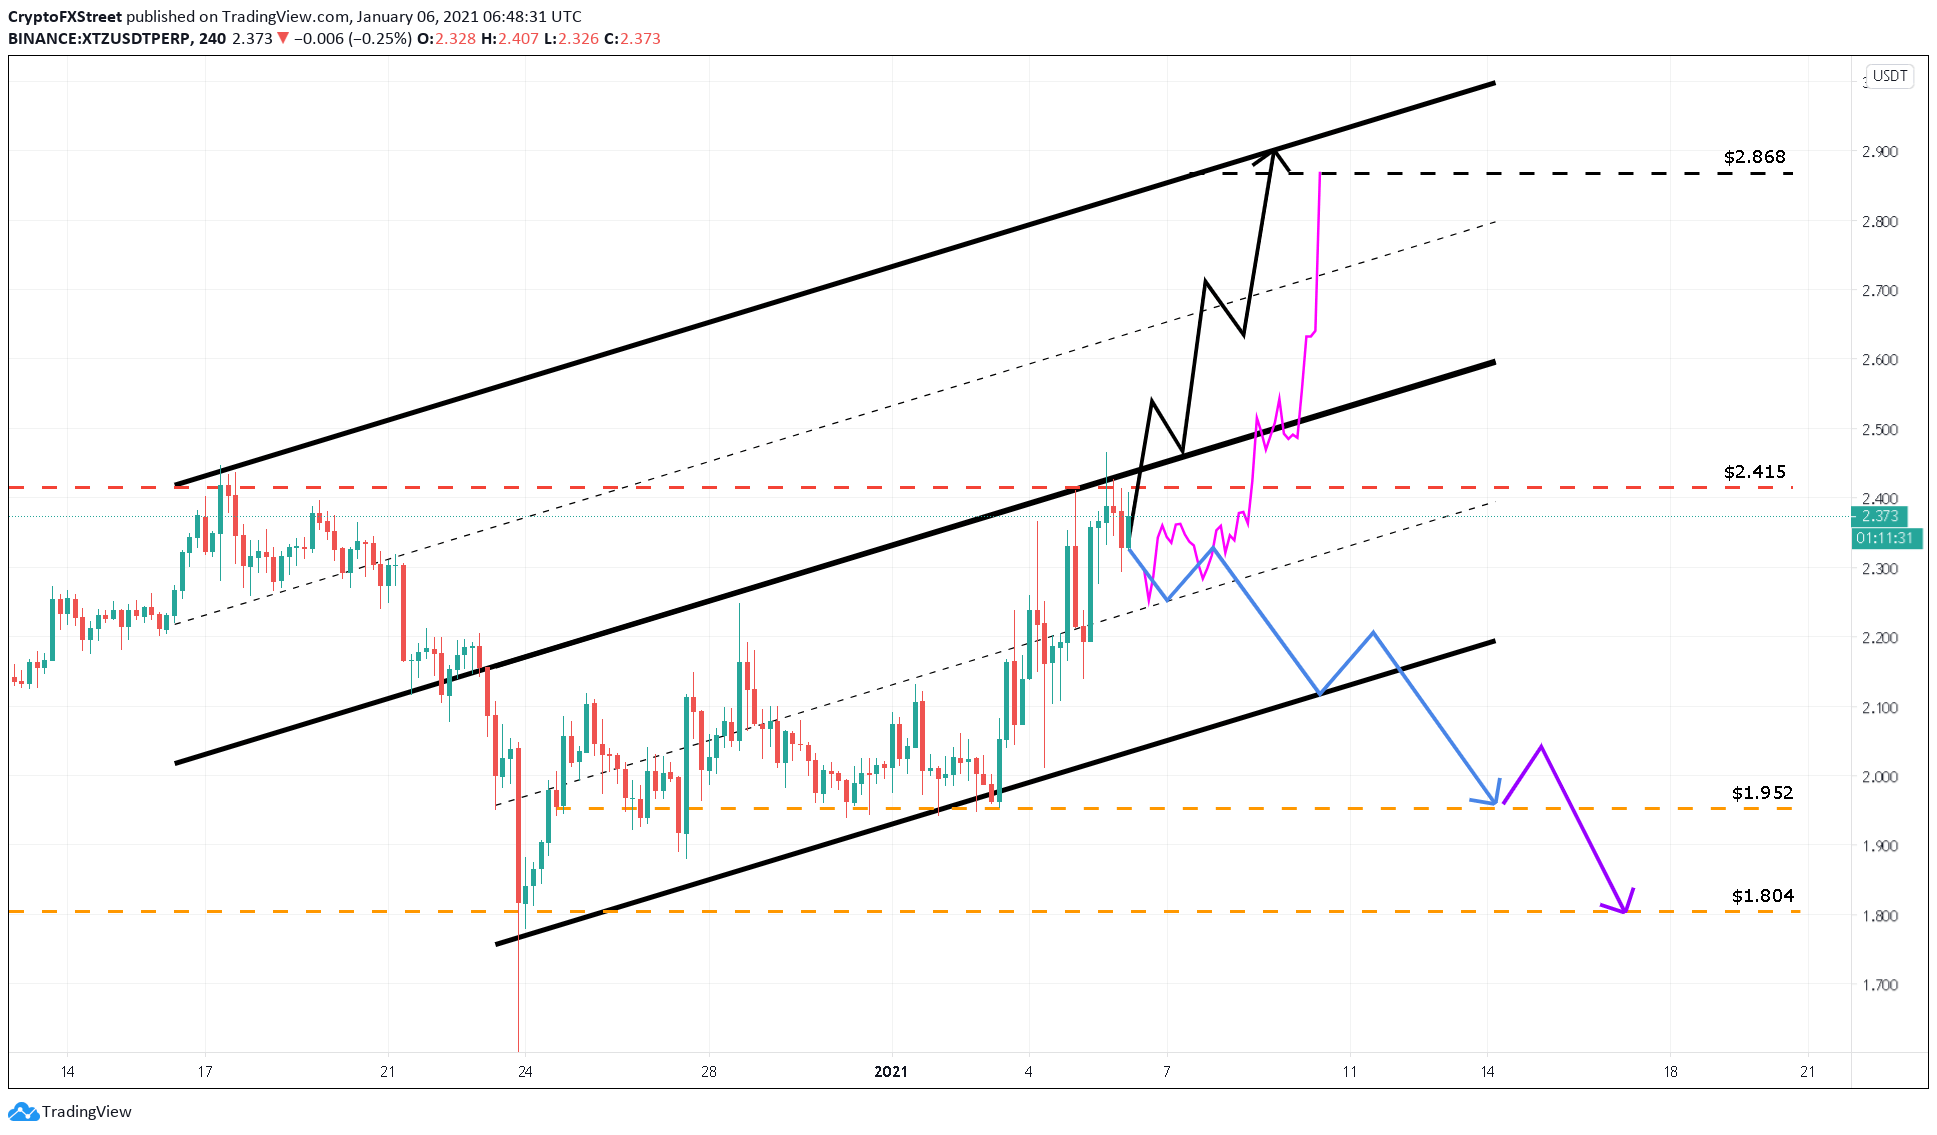
XTZ/USD 4-hour chart
While all of these scenarios seem plausible, there is a bearish scenario that might come to play. Although unlikely, it shouldn't be neglected due to the unpredictability of the cryptocurrency market. Failing to breach the resistance level at $2.42 may lead to a full-blown retracement.
In case the bearish scenario does play out, there are two fundamental levels to keep an eye out for, the $1.95-level, which will represent a 17% downswing from the current price. Further selling pressure around this price level could cause Tezos to buckle under pressure and head to $1.80. The blue and purple path lines represent these scenarios, as seen in the above chart.
Information on these pages contains forward-looking statements that involve risks and uncertainties. Markets and instruments profiled on this page are for informational purposes only and should not in any way come across as a recommendation to buy or sell in these assets. You should do your own thorough research before making any investment decisions. FXStreet does not in any way guarantee that this information is free from mistakes, errors, or material misstatements. It also does not guarantee that this information is of a timely nature. Investing in Open Markets involves a great deal of risk, including the loss of all or a portion of your investment, as well as emotional distress. All risks, losses and costs associated with investing, including total loss of principal, are your responsibility. The views and opinions expressed in this article are those of the authors and do not necessarily reflect the official policy or position of FXStreet nor its advertisers. The author will not be held responsible for information that is found at the end of links posted on this page.
If not otherwise explicitly mentioned in the body of the article, at the time of writing, the author has no position in any stock mentioned in this article and no business relationship with any company mentioned. The author has not received compensation for writing this article, other than from FXStreet.
FXStreet and the author do not provide personalized recommendations. The author makes no representations as to the accuracy, completeness, or suitability of this information. FXStreet and the author will not be liable for any errors, omissions or any losses, injuries or damages arising from this information and its display or use. Errors and omissions excepted.
The author and FXStreet are not registered investment advisors and nothing in this article is intended to be investment advice.
Recommended Content
Editors’ Picks

Litecoin Price Prediction: LTC tries to retake $100 resistance as miners halt sell-off
Litecoin price grazed 105 mark on Monday, rebounding 22% from the one-month low of $87 recorded during last week’s market crash. On-chain data shows sell pressure among LTC miners has subsided. Is the bottom in?

Bitcoin fails to recover as Metaplanet buys the dip
Bitcoin price struggles around $95,000 after erasing gains from Friday’s relief rally over the weekend. Bitcoin’s weekly price chart posts the first major decline since President-elect Donald Trump’s win in November.

SEC Commissioner Hester Pierce sheds light on Ethereum ETF staking under new administration
In a Friday interview with Coinage, SEC Commissioner Hester Peirce discussed her optimism about upcoming regulatory changes as the agency transitions to new leadership under President Trump’s pick for new Chair, Paul Atkins.

Bitcoin dives 3% from its recent all-time high, is this the cycle top?
Bitcoin investors panicked after the Fed's hawkish rate cut decision, hitting the market with high selling pressure. Bitcoin's four-year market cycle pattern indicates that the recent correction could be temporary.
Bitcoin: 2025 outlook brightens on expectations of US pro-crypto policy
Bitcoin price has surged more than 140% in 2024, reaching the $100K milestone in early December. The rally was driven by the launch of Bitcoin Spot ETFs in January and the reduced supply following the fourth halving event in April.

Best Forex Brokers with Low Spreads
VERIFIED Low spreads are crucial for reducing trading costs. Explore top Forex brokers offering competitive spreads and high leverage. Compare options for EUR/USD, GBP/USD, USD/JPY, and Gold.