Tezos Price Prediction: XTZ takes off while technical levels improve
- Tezos breaks out of a ranging channel as bulls target liftoff to new all-time highs.
- XTZ must close the day above $5, which may open the door to highs past $5.6.
- The TD Sequential indicator flashed a sell signal likely to invalidate the upswing.

Tezos had over the last two weeks danced within the confines of a ranging channel as illustrated on the four-hour chart. Last week’s dip embraced support at $3.8, giving way to the resumed uptrend. A break above the channel has validated XTZ’s bullish outlook.
Tezos back in the bulls’ hands
Tezos is trading at $4.74 at the time of writing. The prevailing trend is massively bullish, as reinforced by the Relative Strength Index (RSI) on the four-hour chart. This trend strength indicator has entered the overbought region and is unlikely to reverse in the near term.

XTZ/USD four-hour chart
Uplift past $5 would validate the acceleration to a new all-time high. Note that the 50 Simple Moving Average (SMA) on the four-hour chart holds above the 100 SMA and the 200 SMA, implying the trend is favoring the bulls.
Looking at the other side of the fence
The TD Sequential indicator has flashed a sell signal on the four-hour chart. The call to sell manifested in a green nine candlestick. This signal shows that the bullish momentum could be fading while giving way for sellers to take control.
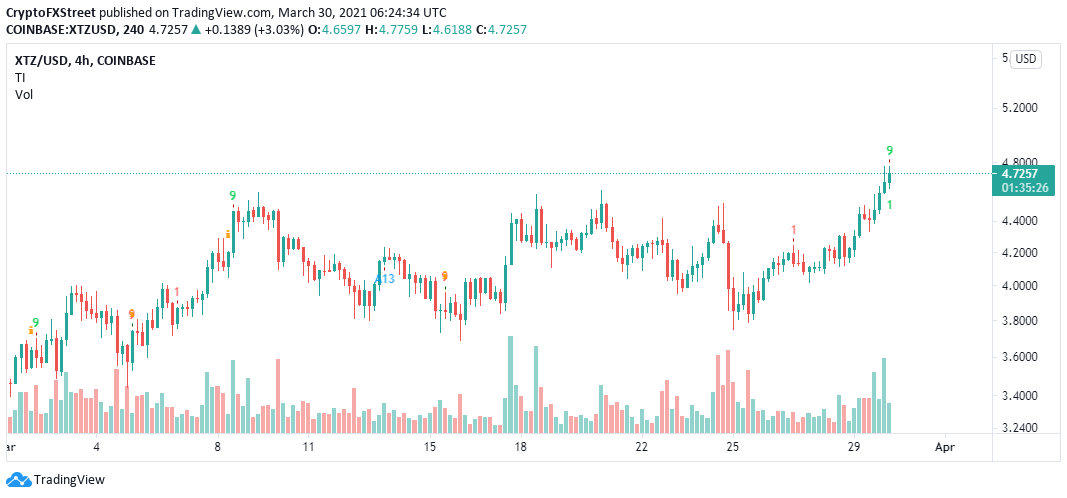
XTZ/USD four-hour chart
Note that if the sell signal is validated, Tezos will start to lose ground. A return into the ranging channel may also trigger more sell orders. On the downside, primary support is anticipated at $3.8; however, the 50 SMA, 100 SMA and 200 SMA are in line to prevent a potentially massive freefall.
Author

John Isige
FXStreet
John Isige is a seasoned cryptocurrency journalist and markets analyst committed to delivering high-quality, actionable insights tailored to traders, investors, and crypto enthusiasts. He enjoys deep dives into emerging Web3 tren


