- The daily chart highlights the formation of a golden cross pattern, implying that Tezos uptrend is intact.
- XTZ's liftoff above $4.5 is a conservative prediction based on the prevailing technical picture.
- A correction may come into the picture if the TD Sequential indicator's sell signal is validated.
Tezos is relentless in the fight for all-time highs and perhaps the opportunity to set a historical record. The resistance discussed at $3.5 has been broken, allowing bulls to push XTZ past $4. At the time of writing, Tezos is dancing at $4.05 amid the constant battle to overshoot the all-time highs at $4.5.
Tezos uptrend seems sustainable
XTZ is up 163% from the December low at $1.53. Although the recovery journey has been steady, the most significant price action occurred after Tezos stepped above all the three moving averages, the 100 Simple Moving Average, the 50 SMA, and the 200 SMA on the daily chart.
Recovery in the first week of February has also been continuous, characterized by the liftoff above $3.5. Short term analysis reinforces the bullish scenario as shown by the Moving Average Convergence Divergence (MACD). In addition to being in the positive region (above the zero line), the MACD line (blue) has crossed above the signal line, adding credence to the bullish picture.
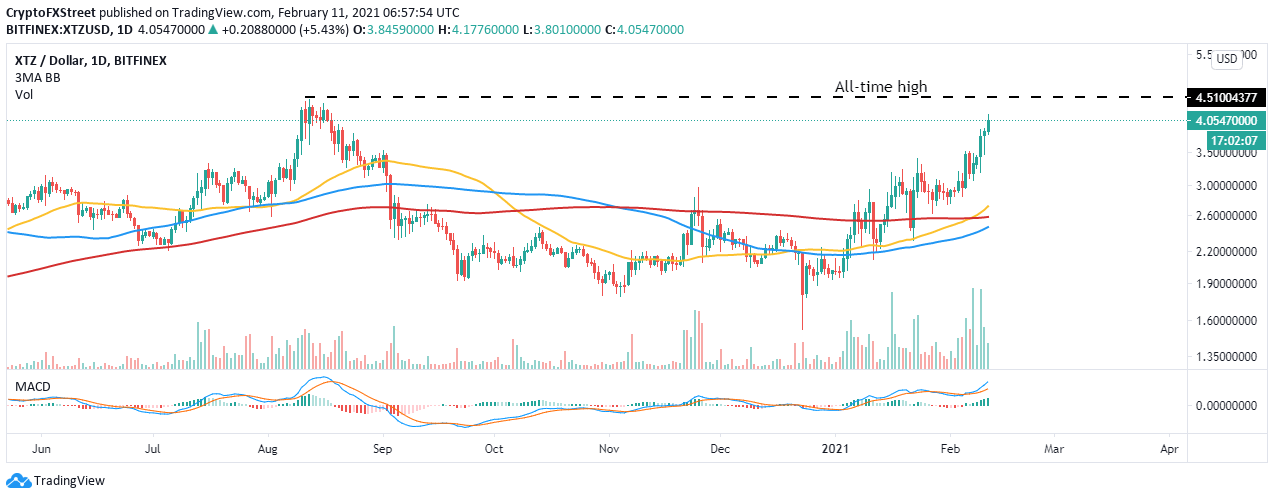
XTZ/USD daily chart
The same daily chart illustrates a golden cross pattern, which is a crucial bullish indicator. The pattern materializes when short-term moving average steps above a longer-term moving average. For instance, the 50 Simple Moving Average (SMA) has recently crossed above the 200 SMA.
Note that the last time this particular pattern occurred was in December 2019 and culminated in a 250% upswing. In other words, if the technical picture remains intact, Tezos' uptrend is just at its initial stages. Thus the all-time high at $4.5 is a conservative prediction.
Looking at the other side of the fence
The TD Sequential indicator has recently flashed a sell signal on the daily chart. The call to sell was revealed in a green nine candlestick. It implies that the uptrend is nearing exhaustion, and it is time to tread carefully.
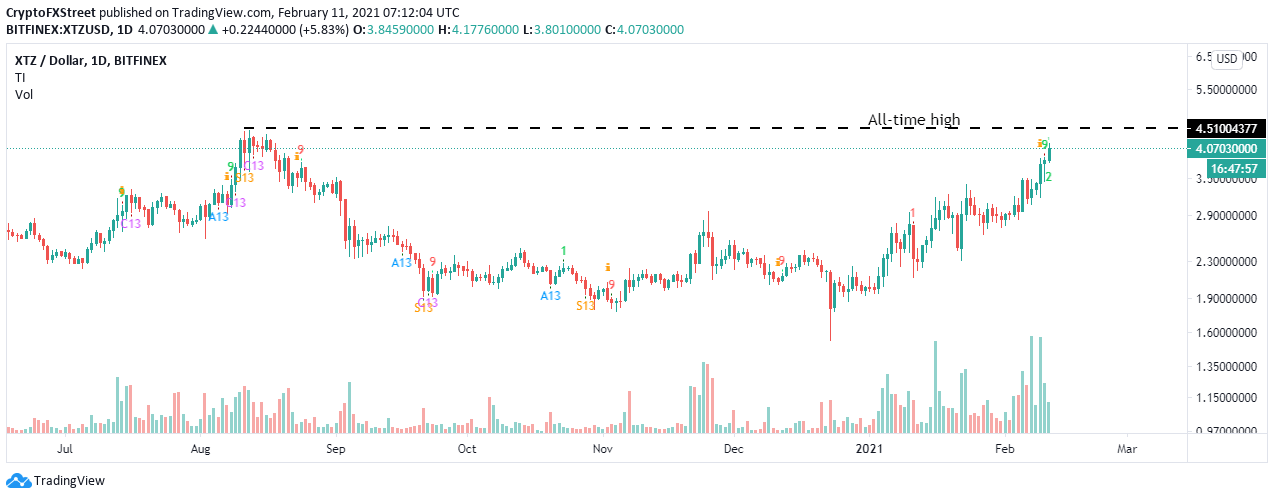
XTZ/USD daily chart
If validated, Tezos could fall in one to four daily candlesticks. The sell signal tells the investors to refrain from buying and consider selling because a reversal is probable. A correction from the current price level will be detrimental to the accrued gains. The formidable support levels include the 50 SMA currently at $2.7, the 100 SMA at $2.45.
Information on these pages contains forward-looking statements that involve risks and uncertainties. Markets and instruments profiled on this page are for informational purposes only and should not in any way come across as a recommendation to buy or sell in these assets. You should do your own thorough research before making any investment decisions. FXStreet does not in any way guarantee that this information is free from mistakes, errors, or material misstatements. It also does not guarantee that this information is of a timely nature. Investing in Open Markets involves a great deal of risk, including the loss of all or a portion of your investment, as well as emotional distress. All risks, losses and costs associated with investing, including total loss of principal, are your responsibility. The views and opinions expressed in this article are those of the authors and do not necessarily reflect the official policy or position of FXStreet nor its advertisers. The author will not be held responsible for information that is found at the end of links posted on this page.
If not otherwise explicitly mentioned in the body of the article, at the time of writing, the author has no position in any stock mentioned in this article and no business relationship with any company mentioned. The author has not received compensation for writing this article, other than from FXStreet.
FXStreet and the author do not provide personalized recommendations. The author makes no representations as to the accuracy, completeness, or suitability of this information. FXStreet and the author will not be liable for any errors, omissions or any losses, injuries or damages arising from this information and its display or use. Errors and omissions excepted.
The author and FXStreet are not registered investment advisors and nothing in this article is intended to be investment advice.
Recommended Content
Editors’ Picks

Ethereum Price Forecast: ETH ETFs total net assets plummet over 60%; Justin Sun says he won't sell ETH
Ethereum traded just below $1,600 on Thursday following a 60% plunge in the total net assets of US spot Ether ETFs.

Binance Coin price nears $600 breakout as CZ reacts to BNB listing on Kraken
Binance Coin price posted considerable gains on Thursday, fuelled by investor optimism tied to its upcoming listing on the U.S.-based crypto exchange Kraken.

Binance CEO affirms company's involvement in advising countries on Bitcoin Reserve
Binance CEO Richard Teng shared in a report on Thursday that the cryptocurrency exchange has advised different governments on crypto regulations and the need to create a strategic Bitcoin reserve.

Slovenia moves to impose 25% tax on crypto traders
Slovenia has become the latest European Union member state to crack down on untaxed crypto gains, unveiling a proposal to impose a 25% tax on personal profits from digital asset disposals starting in 2026.
Bitcoin Weekly Forecast: Market uncertainty lingers, Trump’s 90-day tariff pause sparks modest recovery
Bitcoin (BTC) price extends recovery to around $82,500 on Friday after dumping to a new year-to-date low of $74,508 to start the week. Market uncertainty remains high, leading to a massive shakeout, with total liquidations hitting $2.18 billion across crypto markets.

The Best brokers to trade EUR/USD
SPONSORED Discover the top brokers for trading EUR/USD in 2025. Our list features brokers with competitive spreads, fast execution, and powerful platforms. Whether you're a beginner or an expert, find the right partner to navigate the dynamic Forex market.