![]() Sheldon McIntyre, CMT
Sheldon McIntyre, CMT
Independent Analyst
- Tezos price suspends rebound after striking critical resistance at $3.10.
- Rapidly declining 50-day simple moving average (SMA) exerting pressure on XTZ.
- 2019 trend line remains a key support level if price structure deteriorates.
Tezos price rebound from below the May 23 low, and the 2019 trend line has not generated any upside in July after abruptly stalling at $3.10. The break below the minor trend line from June 22 may signal further weakness moving forward or an evolution in the price structure to a range-bound scenario, between the May 23 low of $2.42 and $3.10. Either way, XTZ is off-limits for long-term investors until a daily close above $3.12.
Tezos price offers alternatives, but a clear opportunity has yet to be revealed
Tezos price experienced a 37% decline in 2Q and a 16% slump in June after staging a rebound from below the longstanding 2019 trend line. The performance was not a wide deviation from the broad cryptocurrency complex and reflected a digital asset that rarely headlines the crypto news roll.
The 46% rebound from the June 22 low of $2.11 until the July 4 high of $3.11 enabled XTZ to recapture the 2019 trend line and the May 23 low of $2.42, but it was overshadowed by the bearish Death Cross pattern that activated on June 27.
Recently, Tezos price has been interrupted by the formidable resistance around $3.10 that was support in June before the plunge on June 21. Moreover, XTZ is weighed down by the declining 50-day SMA, currently at $3.28.
A daily close below $2.75 would confirm a stage of retracement that will likely persuade Tezos price to test the 2019 trend line now at $2.55 or even sweep the May 23 low of $2.42, logging a 15% decline from the current price.
If XTZ registers a daily close below the May 23 low, Tezos price will sweep the June 22 low of $2.11, generating a 26% decline from the current price. Any further support levels would need to be considered following a daily close below the June 22 low.
A second alternative Tezos price may opt for is a trading range underpinned by the 2019 trend line or the June 23 low, intercepted by the resistance around $3.10. It could establish a series of profitable opportunities for swing and day traders while frustrating long-term XTZ speculators.
A final scenario is for Tezos price to realize a daily close above $3.12 that invites an acceleration in buying demand and potentially a rally to the strategically important 200-day SMA, currently at $3.95. It would represent a 27% rally from $3.12, but XTZ would need to overcome the resistance established by the declining 50-day SMA at $3.28.
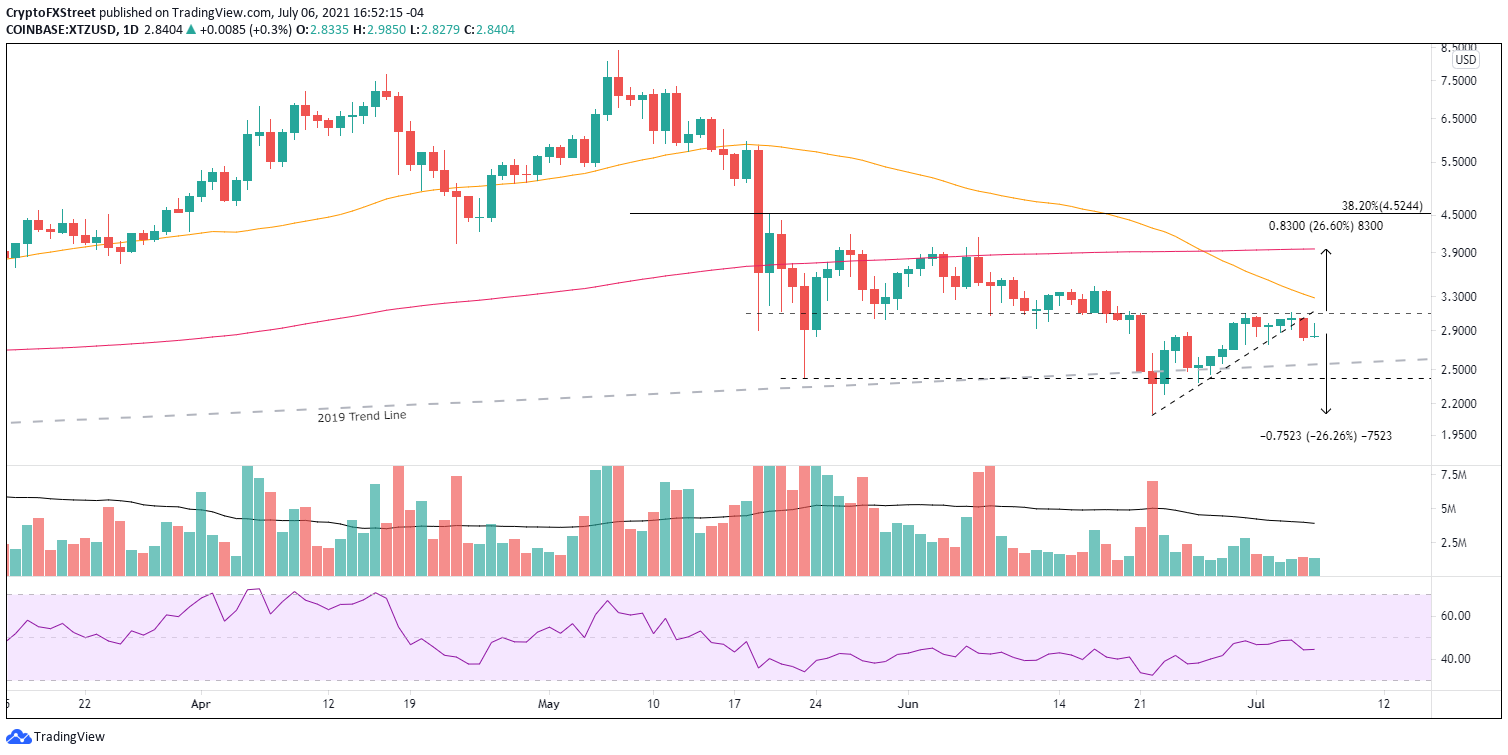
XTZ/USD daily chart
Tezos price is challenging XTZ investors with three potential investment storylines, none of which has taken the pole position. Based on the charts and meshed with the uncertainty governing many altcoins, it would be shrewd for long-term investors to let Tezos price activate the bulls with a close above $3.12 and then allocate capital if it is a high probability opportunity.
Note: All information on this page is subject to change. The use of this website constitutes acceptance of our user agreement. Please read our privacy policy and legal disclaimer. Opinions expressed at FXstreet.com are those of the individual authors and do not necessarily represent the opinion of FXstreet.com or its management. Risk Disclosure: Trading foreign exchange on margin carries a high level of risk, and may not be suitable for all investors. The high degree of leverage can work against you as well as for you. Before deciding to invest in foreign exchange you should carefully consider your investment objectives, level of experience, and risk appetite. The possibility exists that you could sustain a loss of some or all of your initial investment and therefore you should not invest money that you cannot afford to lose. You should be aware of all the risks associated with foreign exchange trading, and seek advice from an independent financial advisor if you have any doubts.
Recommended Content
Editors’ Picks

Top 3 gainers Supra, Cosmos Hub, EOS: Supra leads recovery after Trump’s tariffs announcement
Supra’s 25% surge on Friday calls attention to lesser-known cryptocurrencies as Bitcoin, Ethereum and XRP struggle. Cosmos Hub remains range-bound while bulls focus on a potential inverse head-and-shoulders pattern breakout.

Bitcoin Weekly Forecast: Tariff ‘Liberation Day’ sparks liquidation in crypto market
Bitcoin price remains under selling pressure around $82,000 on Friday after failing to close above key resistance earlier this week. Donald Trump’s tariff announcement on Wednesday swept $200 billion from total crypto market capitalization and triggered a wave of liquidations.

Can Maker break $1,450 hurdle as whales launch buying spree?
Maker is back above $1,300 on Friday after extending its lower leg to $1,231 the previous day. MKR’s rebound has erased the drawdown that followed United States President Donald Trump’s ‘Liberaton Day’ tariffs on Wednesday, which targeted 100 countries.

Gold shines in Q1 while Bitcoin stumbles
Gold gains nearly 20%, reaching a peak of $3,167, while Bitcoin nosedives nearly 12%, reaching a low of $76,606, in Q1 2025. In Q1, the World Gold ETF's net inflows totalled 155 tonnes, while the Bitcoin spot ETF showed a net inflow of near $1 billion.
Bitcoin Weekly Forecast: Tariff ‘Liberation Day’ sparks liquidation in crypto market
Bitcoin (BTC) price remains under selling pressure and trades near $84,000 when writing on Friday after a rejection from a key resistance level earlier this week.

The Best brokers to trade EUR/USD
SPONSORED Discover the top brokers for trading EUR/USD in 2025. Our list features brokers with competitive spreads, fast execution, and powerful platforms. Whether you're a beginner or an expert, find the right partner to navigate the dynamic Forex market.