Tezos Price Analysis: XTZ in the vicinity of a 20% upswing as technicals turn bullish
- Tezos price seems poised for a bullish move as several indicators have turned bullish.
- The digital asset faces one crucial resistance level before a potential move to $3.

Tezos had a massive dive on January 10 from its 2021-high at $2.94 down to $2.1. The digital asset is trying to recover and it’s on the verge of establishing an uptrend in the short-term, but still faces one significant resistance level.
Tezos price can quickly jump to $3 if bulls can crack this level
On the 4-hour chart, the strongest resistance level is the 50-SMA located at $2.5. A breakout above this level can drive Tezos price to a high of $3 as there is very little resistance on the way up.
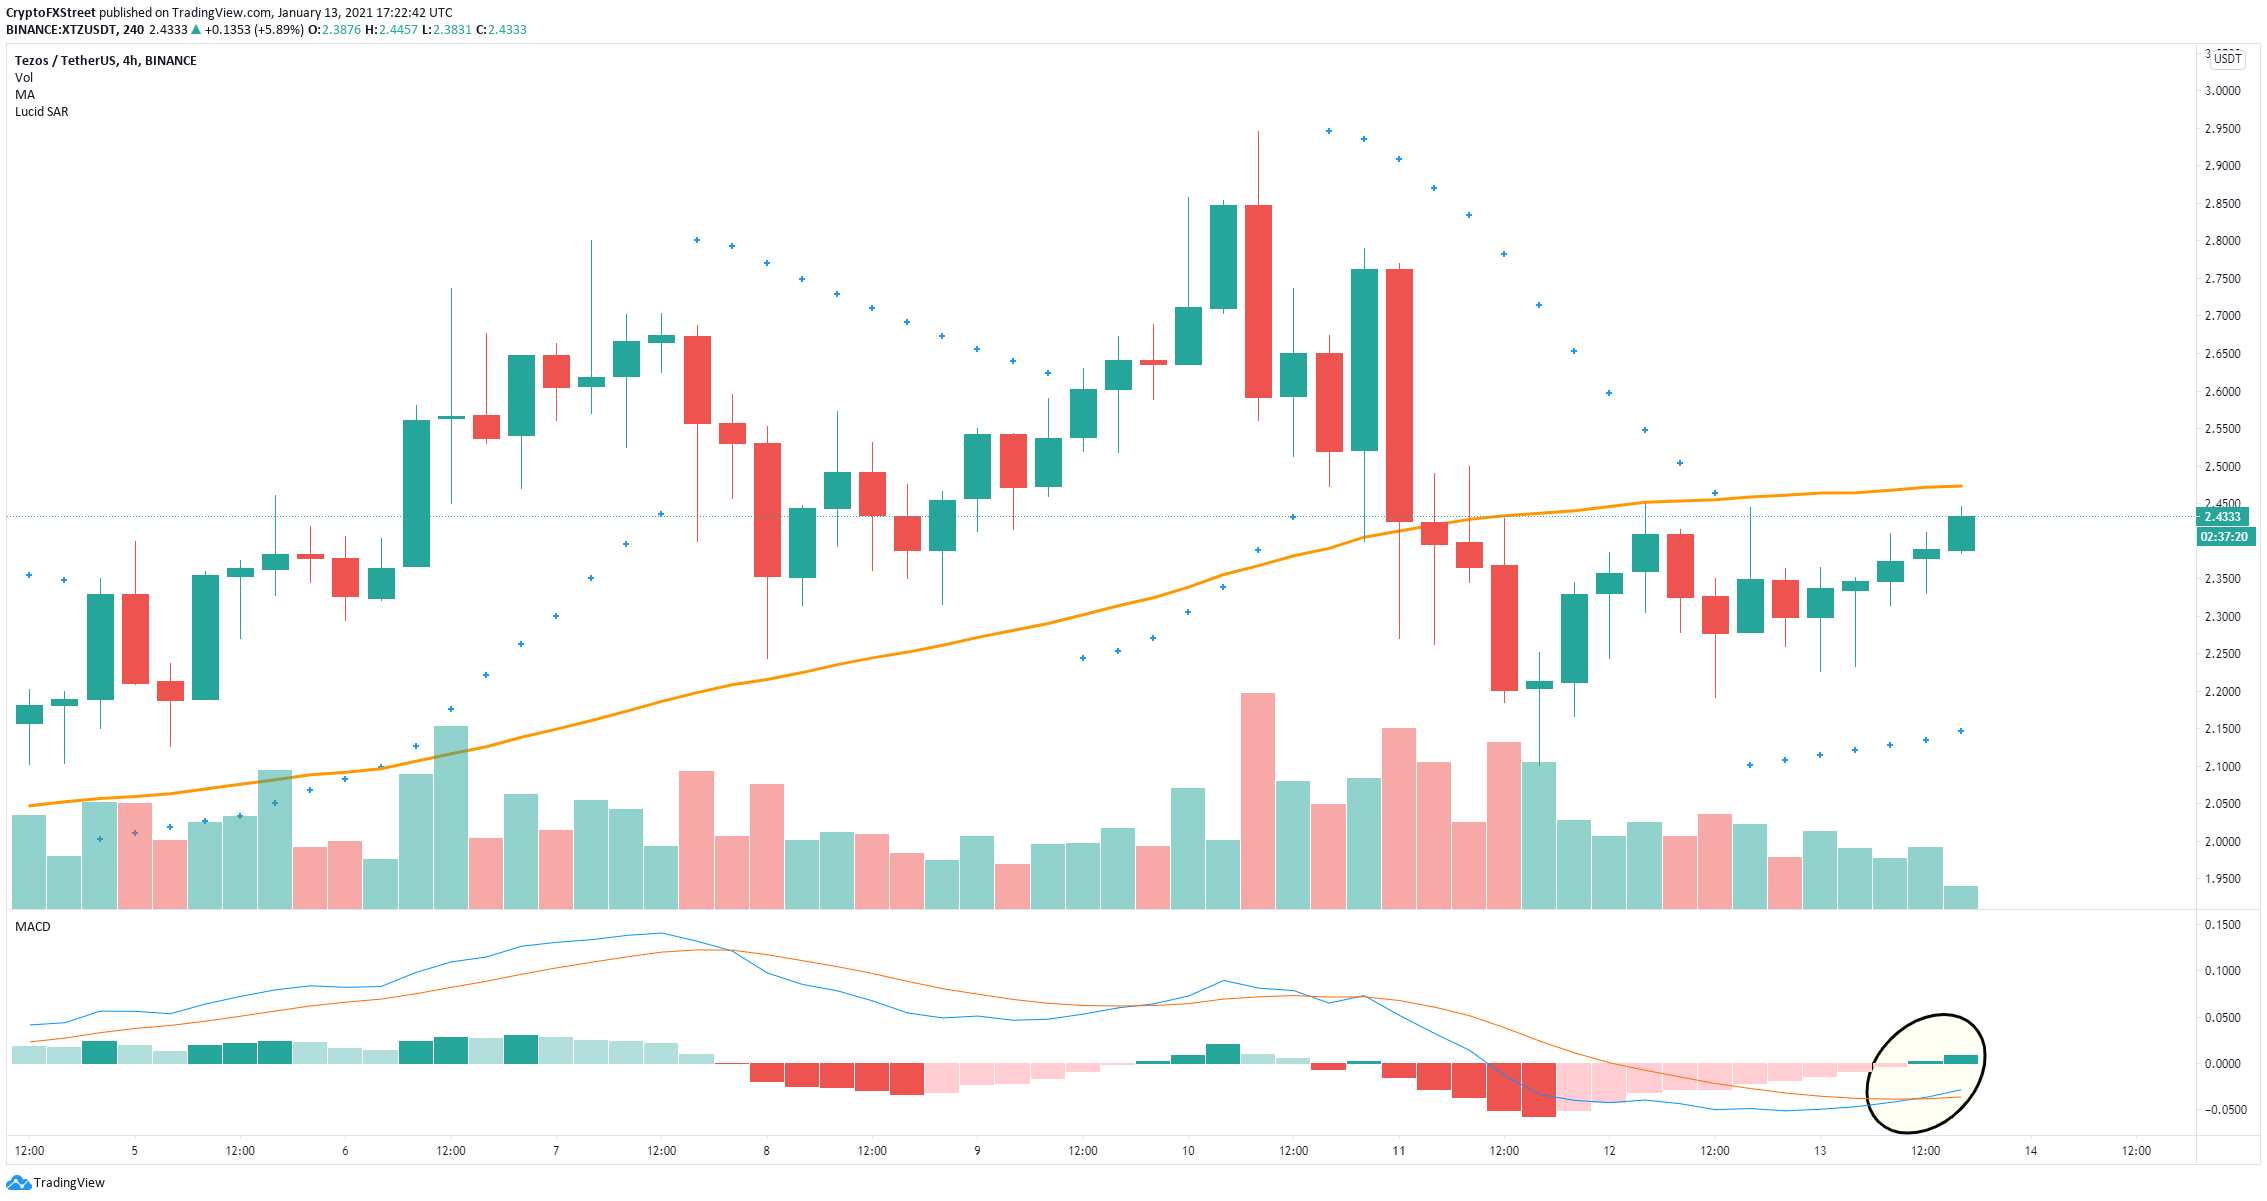
XTZ/USD 4-hour chart
The MACD has just flipped bullish again and the Parabolic SAR turned positive in the past 10 hours, both indicators adding a lot of credence to the potential of a bullish breakout above $2.5.
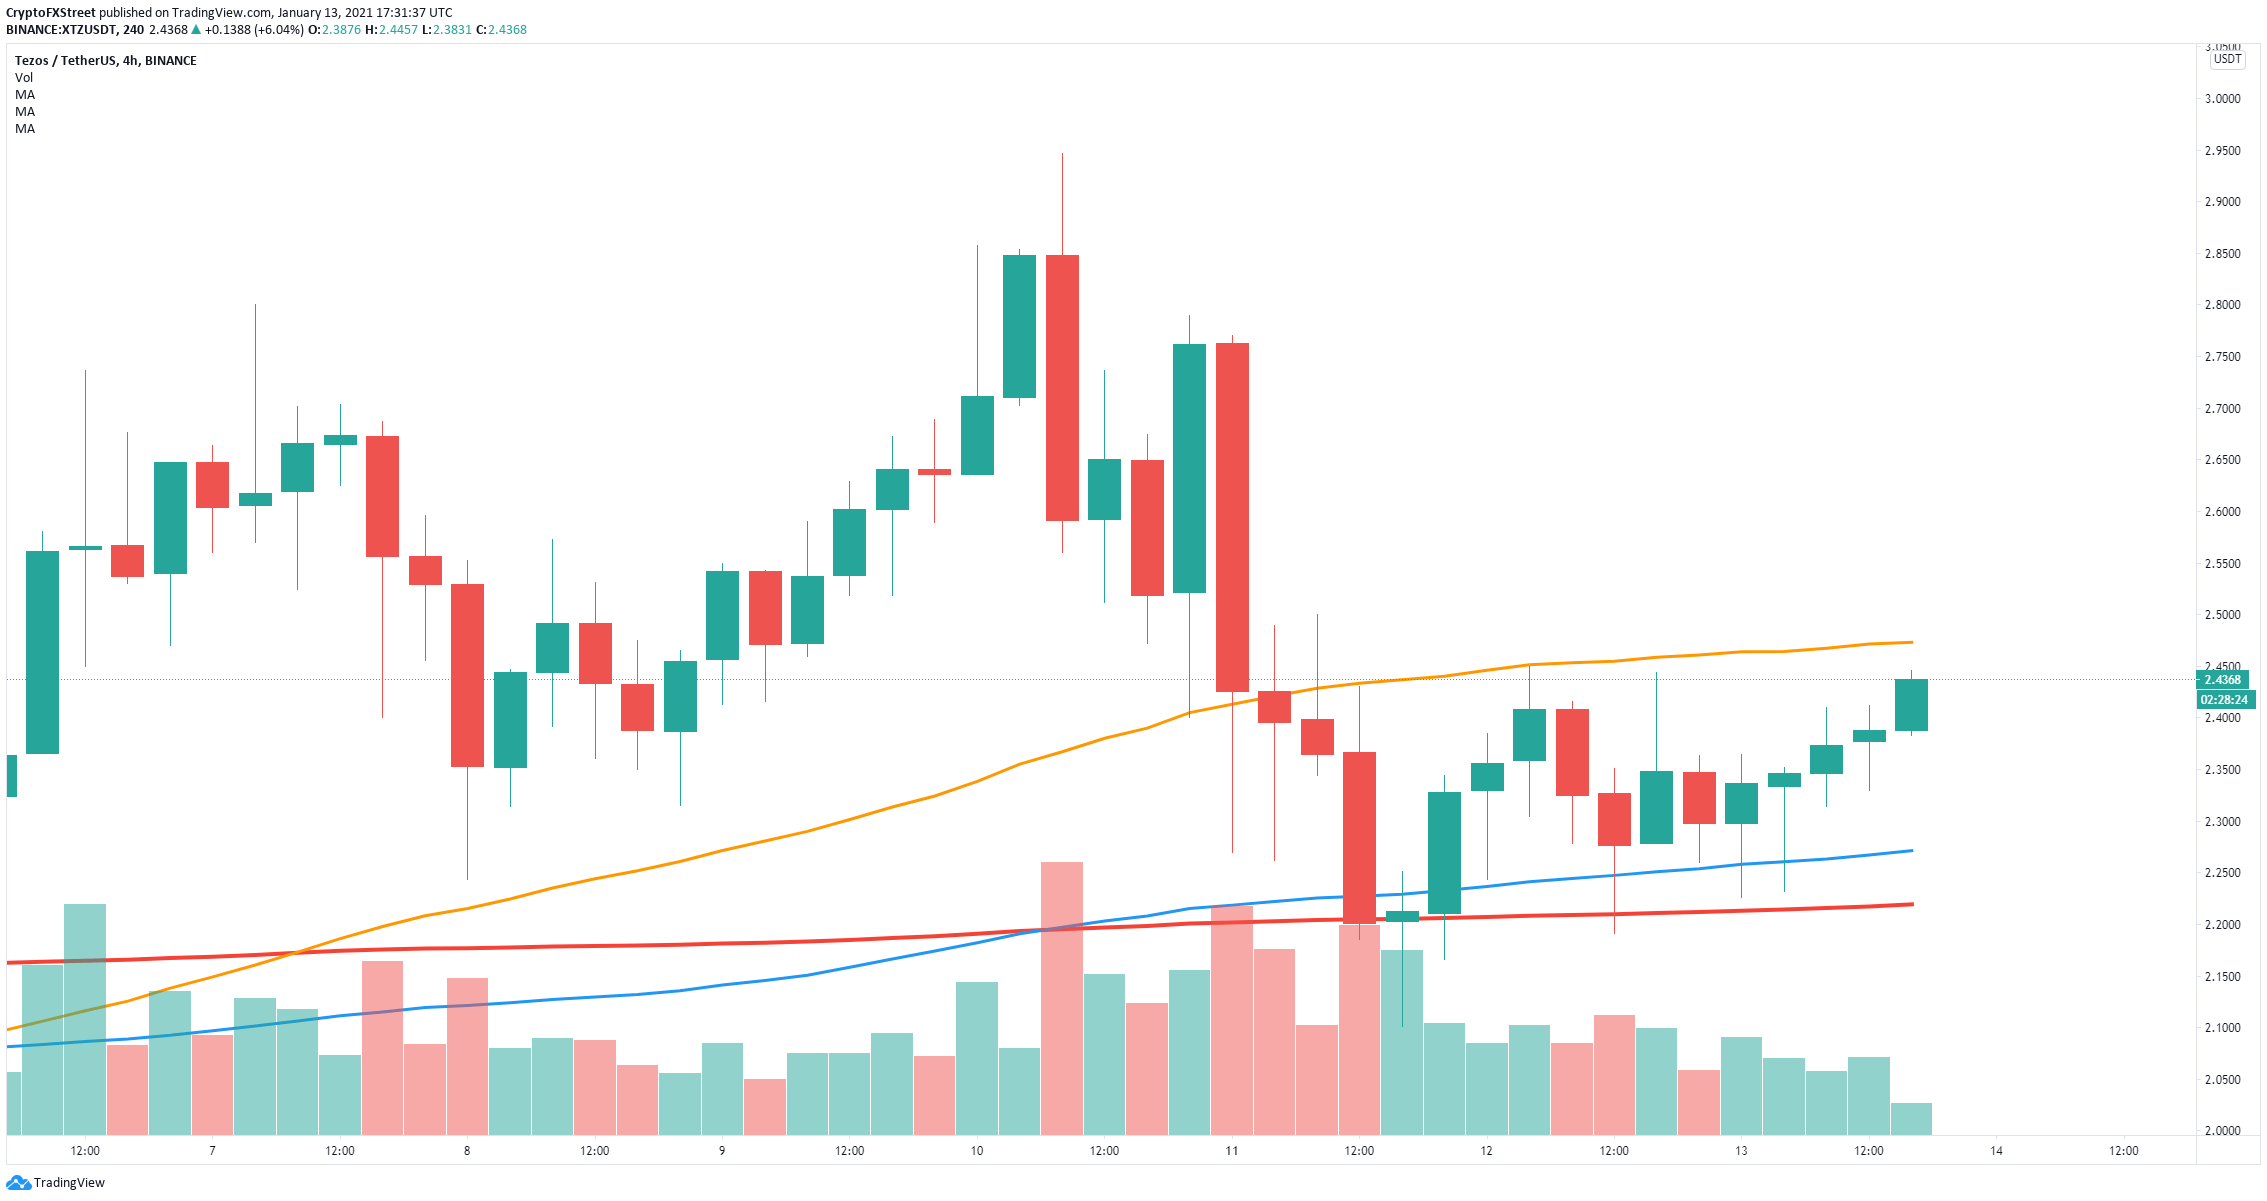
XTZ/USD 4-hour chart
However, a rejection from the 50-SMA level, which coincides with a high established on January 12, can quickly shift the odds back in favor of the bears. Tezos price could fall towards the 100-SMA at $2.27 and as low as the 200-SMA at $2.22.
Author

Lorenzo Stroe
Independent Analyst
Lorenzo is an experienced Technical Analyst and Content Writer who has been working in the cryptocurrency industry since 2012. He also has a passion for trading.


